Molecular Spectroscopy Market by Technology (NMR (FT, Continuous Wave), UV-Visible (Array-based, Dual-beam), IR (Terahertz, Benchtop), NIR (FT-NIR), Raman (SERS, TERS, FT Raman)), Application (Pharmaceutical, Food, Biotechnology) - Global Forecast to 2022


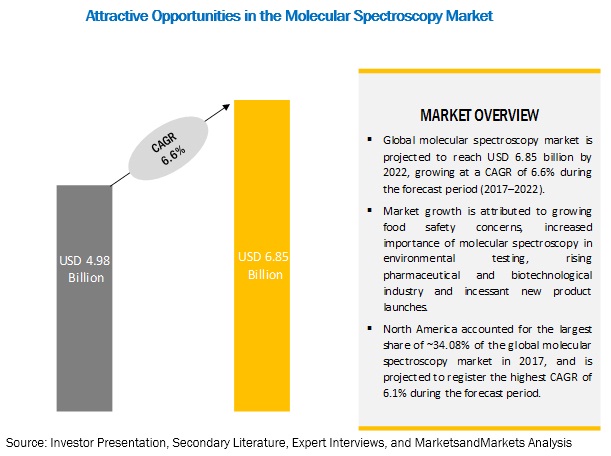
[217 Pages Report] The global molecular spectroscopy market is expected to reach USD 6.85 billion by 2022 from USD 4.98 billion in 2017, at a CAGR of 6.6%. The growth of this market is majorly driven by food safety concerns, the growth of the pharmaceutical and biotechnology industry, technological advancements in molecular spectroscopy and application of molecular spectroscopy in environmental screening. However, the high cost of equipment is likely to restrain the growth of the market during the forecast period.
By Technology, the raman spectroscopy segment is expected to grow at the highest growth rate during the forecast period
Based on technology, the molecular spectroscopy market is segmented into Nuclear magnetic resonance (NMR) spectroscopy, UV-visible spectroscopy, infrared (IR) spectroscopy, near-infrared spectroscopy, color measurement spectroscopy, raman spectroscopy, and other technologies (fluorescence spectroscopy and hybrid spectroscopy). The raman spectroscopy segment is expected to grow at the highest CAGR of the global market in 2017. The wide applications of this technique coupled with the availability of technologically advanced products are driving the growth of this segment.
The pharmaceutical application is projected to grow at the highest CAGR during the forecast period
Based on application, the molecular spectroscopy market is segmented into pharmaceutical applications, environmental testing, food and beverage testing, biotechnology and biopharmaceutical application, academic research and other applications. During the forecast period, the pharmaceutical application is expected to grow at the highest CAGR. This growth is mainly due to the growing importance of molecular spectroscopy in various stages of drug development and increasing R&D in pharmaceutical industries.
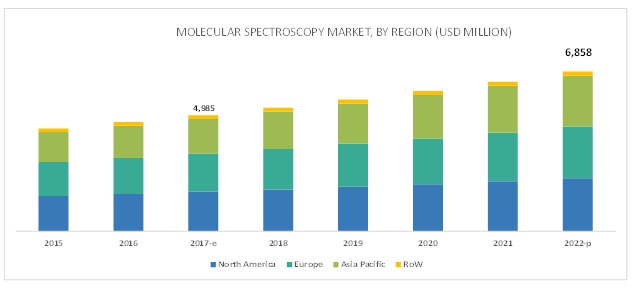
Asia Pacific to witness the highest growth during the forecast period
Asia Pacific is expected to grow at the highest CAGR in the global molecular spectroscopy market during the forecast period of 2017�2022. Thriving biotechnology market in China, growing focus on environmental protection, growing biomedical and medical research in Japan, and rising food safety concerns in India are expected to drive market growth during the forecast period.
Market Dynamics
Application of Molecular Spectroscopy in Environmental Screening
The rising levels of environmental pollution, coupled with the severe depletion of natural resources, are the major factors that have brought into effect several laws and regulations to monitor environmental pollution levels. For instance, in the U.S., the Safe Drinking Water Act (SDWA), Clean Water Act (CWA), and Resource Conservation and Recovery Act (RCRA) focus on regulating the quality of the environment through the use of analytical tools, such as molecular spectroscopy. In environmental applications, molecular spectroscopy is used in the following areas:
- Wastewater Treatment: To analyze the changes in the concentration/composition of inlet water
- Water Safety Analysis: To quantify bacterial concentration levels and the concentration of other constituents in water samples
- Measurement of PAH (Polycyclic Aromatic Hydrocarbons) Levels in the Environment: To monitor PAH levels, as this substance is shown to cause carcinogenic and mutagenic effects and is a potent immunosuppressant
- Evaluate the Environmental Impact of Mining: Trace levels of contamination can be detected using molecular spectroscopy; harmful acid-producing mine drainage can be detected immediately using the technique.
Molecular spectroscopy is the mainstay of several studies conducted by environmental research and conservation agencies across the world. RAMAN, Fourier-transform infrared (FTIR), and X-ray photoelectron spectroscopy are frequently used to study the chemical characteristics of bacterial cell surfaces in biofilm-related research. Additionally, several studies have employed FTIR spectroscopy to obtain in situ biochemical and physiological information on biofilms to monitor and map changes in their development (Source: Methodological approaches for studying the microbial ecology of drinking water distribution systems, Elsevier, 2014). The widespread use of molecular spectroscopy as an analytical tool in environmental studies and research is expected to drive market growth, especially due to the increasing research in the field of environmental conservation and the presence of government regulations promoting environmental studies.
High cost of molecular spectroscopy systems
Spectroscopy instruments are equipped with advanced features and functionalities and thus are priced at a premium. Apart from the cost of the system itself, the cost of compliance of the system to industry standards is also very high. �Compliance� refers to the process that the molecular spectroscopy system is put through to ensure that it meets the set of regulations specific to the industry where it is used (whether government-mandated or self-imposed). To achieve compliance with industry standards, spectroscopy systems must fulfill the following requirements:
- Verification: The verification process, also termed as performance verification, demonstrates that the spectrometer works properly at any given time.
- Qualification: The purpose of qualification is to provide a high degree of confidence that the system will work as per its intended purpose and to document this for the regulating agencies. In qualification, a well-documented and rigorous evaluation process is used while purchasing as well as commissioning an instrument.
- Validation: Validation is the process of proving and fully documenting that the spectrometer is appropriate for the intended task. This process covers the installation and operation of the full system, including the software, accessories, the intended application, and all the related standard operating procedures (SOPs).
Potential applications of tetra hertz spectroscopy in healthcare
Rapid advances in technology have demonstrated the capability of terahertz spectroscopy in various healthcare applications. The focus on using terahertz spectroscopy in biomedical applications has increased rapidly, and several studies are being conducted to investigate its potential applications in pharmaceutical quality control, protein characterization, and cancer detection. T-rays are non-invasive and non-ionizing and thus can be focused harmlessly on the body to capture signs of cancer. Due to these advantages, terahertz spectroscopy is used in a number of cancer-related research activities. In 2016, terahertz spectroscopy was used for the detection of breast cancer by researchers at the University of Bordeaux, France (Source: THz Spectroscopy and Imaging for Breast Cancer Detection in the 300-500 GHz range, Q. Cassar et al. 2016). In 2014, researchers from the University of Leeds (U.K.), in collaboration with the University of Queensland (Australia), used terahertz laser imaging systems to diagnose skin cancer. The study stated that terahertz spectroscopy would reduce the need of biopsies to detect skin cancer, allowing for earlier and less-invasive skin cancer diagnosis. Similarly, according to an article published in the Journal of Biomedical Optics in 2014, studies have shown that terahertz spectroscopy has the potential to distinguish brain gliomas from normal brain tissue.
Dearth of skilled professionals
Skilled personnel with relevant experience and knowledge are required for the efficient use of spectroscopy equipment. Errors such as misplacing a sample in FTIR or UV-Vis, or issues such as fingerprints or bubbles in the solution, interfere with the transmission of light through the sample and can impact the quality of the final result. The selection of the right spectroscopy technique (specific to a given task) plays a crucial role in gaining valuable results. The lack of knowledge regarding the right choice of technique not only affects the end results of operations but also incurs several direct and indirect expenses for end users.
Currently, there is a significant dearth of skilled personnel for method development, validation, operation, and troubleshooting activities, which is expected to restrain the growth of the spectroscopy market to a certain extent in the coming years. As per an article in the Science in the City newsletter, Canada�s fast-growing biotech sector will face a shortage of 220,000 workers by 2020. Moreover, in India, there is an average of about 4 full-time researchers per 10,000 people in the labor force. This shortage of skilled labor in major markets is expected to affect the optimum growth potential of the molecular spectroscopy market in the coming years.
Get online access to the report on the World's First Market Intelligence Cloud
- Easy to Download Historical Data & Forecast Numbers
- Company Analysis Dashboard for high growth potential opportunities
- Research Analyst Access for customization & queries
- Competitor Analysis with Interactive dashboard
- Latest News, Updates & Trend analysis
Request Sample Scope of the Report
Get online access to the report on the World's First Market Intelligence Cloud
- Easy to Download Historical Data & Forecast Numbers
- Company Analysis Dashboard for high growth potential opportunities
- Research Analyst Access for customization & queries
- Competitor Analysis with Interactive dashboard
- Latest News, Updates & Trend analysis

|
Report Metric |
Details |
|
Market size available for years |
2016�2022 |
|
Base year considered |
2016 |
|
Forecast period |
2017�2022 |
|
Forecast units |
Billion (USD) |
|
Segments covered |
Technology (NMR (FT, Continuous Wave), UV-Visible (Array-based, Dual-beam), IR (Terahertz, Benchtop), NIR (FT-NIR), Raman (SERS, TERS, FT Raman)), Application (Pharmaceutical, Food, Biotechnology) |
|
Geographies covered |
North America, Europe, APAC, RoW |
|
Companies covered |
Bruker (US), Thermo Fisher Scientific, Inc. (U.S), PerkinElmer, Inc. (US), Agilent Technologies, Inc. (US). Major 12 companies covered. |
The research report categorizes the market into the following segments and subsegments:
Molecular Spectroscopy Market, by Technology
- Nuclear Magnetic Resonance (NMR) Spectroscopy
- Continuous-wave (CW) NMR Spectroscopy
- Fourier-transform NMR Spectroscopy (FTS)
- Solid-state NMR Spectroscopy (SSNMR)
- UV-Visible Spectroscopy
- Single-beam UV-Visible Spectroscopy
- Dual-beam UV-Visible Spectroscopy
- Array-based UV-Visible Spectroscopy
- Infrared (IR) Spectroscopy
- IR Spectroscopy, by Spectrum
- Mid-wave Infrared Spectroscopy
- Short-wave Infrared Spectroscopy
- Far-wave Infrared Spectroscopy
- IR Spectroscopy, by Type
- Benchtop
- Hyphenated
- IR Microscopy
- Portable & Handheld
- Terahertz
- IR Spectroscopy, by Spectrum
- Near-infrared Spectroscopy
- Scanning
- Fourier-transform
- Filter or AOTF
- Color Measurement Spectroscopy
- Raman Spectroscopy
- Raman Spectroscopy, by Sampling Technique
- Surface-enhanced Raman Scattering
- Tip-enhanced Raman Scattering
- Other Sampling Techniques
- Raman Spectroscopy, by Type
- Micro-Raman Spectroscopy
- Probe-based Raman Spectroscopy
- FT-Raman Spectroscopy
- Other Technologies (Fluorescence Spectroscopy and Hybrid Spectroscopy)
- Raman Spectroscopy, by Sampling Technique
Molecular Spectroscopy Market, by Application
- Pharmaceutical Applications
- Biotechnology & Biopharmaceutical Applications
- Food & Beverage Testing
- Environment Testing
- Academic Research
- Other Applications
Molecular Spectroscopy Market, by Region
- North America
- US
- Canada
- Europe
- EU5
- Rest of Europe (RoE)
- Asia Pacific
- Japan
- China
- India
- Rest of Asia Pacific
- Rest of the World (RoW)
Key Market Players
Bruker (US), Thermo Fisher Scientific, Inc. (U.S), PerkinElmer, Inc. (US), Agilent Technologies, Inc. (US), Shimadzu Corporation (Japan), Danaher Corporation (US), ABB (Switzerland), Merck KGaA (Germany), JEOL Ltd. (Japan), FOSS (Denmark), JASCO, Inc. (US), and HORIBA Ltd. (US)
Bruker corporation, Inc. (U.S.) is one of the major player in the molecular spectroscopy market in 2016. The company provides a wide range of molecular spectroscopy technologies, accessories, and software in the market. These products find application in a range of industries including pharmaceuticals, environmental agencies, food & beverage, and research laboratories. To maintain its leading position and increase its customer base in the market, the company mainly focuses on expanding its market presence by enhancing its product development capabilities and product launches & enhancements. For instance, in 2017 the company launched TopSpin 4 software, bioTop module, TopSolids software, PotencyMR solution, iProbe platform, and SmartProbe iProbes, an addition to its existing portfolio. Additionally, it has also launched verTera extension for their VERTEX 80v FTIR spectrometer. The company has a strong R&D and manufacturing infrastructure, with its presence in Europe, North America, and Asia Pacific.
Recent Developments
- In 2016, Bruker partnered with International Phenome Centre Network (IPCN), UK, to leverage Bruker�s IVDr by NMR system to aid International Phenome Centre Network (IPCN) in clinical and translational research.
- In 2016, Thermo Fisher Scientific, acquired Affymetrix, Inc. (US), to increase the company�s capabilities in biosciences and genetic analysis
- In 2015, PerkinElmer, collaborated with Johnson & Johnson Innovation (US), to provide analytical instruments and lab services for J&J�s life science incubator.
Critical questions the report answers:
- Which of the product segments will dominate the molecular spectroscopy market in the next five years?
- Emerging countries have immense opportunities for the growth and adoption of molecular spectroscopy, will this scenario continue in the next five years?
- Increasing availability and awareness of advanced technology in the emerging market is impacting the growth for developed markets. How will the pricing difference impact the overall market?
- What are the upcoming technologies in the market?
- Which application segment will dominate the market in the next five years?
To speak to our analyst for a discussion on the above findings, click Speak to Analyst
Table of Contents
1 Introduction (Page No. - 18)
1.1 Objectives of Study
1.2 Market Definition
1.3 Market Scope
1.3.1 Markets Covered
1.3.2 Years Considered for the Study
1.4 Currency
1.5 Limitations
1.6 Stakeholders
2 Research Methodology (Page No. - 22)
2.1 Research Methodology Steps
2.2 Secondary and Primary Research Methodology
2.2.1 Secondary Research
2.2.1.1 Key Data From Secondary Sources
2.2.2 Primary Research
2.2.2.1 Key Industry Insights
2.2.2.2 Key Data From Primary Sources
2.2.2.3 Key Insights From Primary Sources
2.3 Market Size Estimation Methodology
2.4 Market Data Validation and Triangulation
2.5 Assumptions for the Study
3 Executive Summary (Page No. - 32)
4 Premium Insights (Page No. - 35)
4.1 Molecular Spectroscopy Market Snapshot
4.2 Market, By Technology 2017 vs. 2022 (USD Million)
4.3 Market, By Application, 2017 vs. 2022
4.4 Geographic Snapshot of the Market
5 Market Overview (Page No. - 39)
5.1 Introduction
5.2 Market Dynamics
5.2.1 Drivers
5.2.1.1 Applications of Molecular Spectroscopy in Environmental Screening
5.2.1.2 Growing Use of Molecular Spectroscopy in Pharmaceutical & Biotechnology Industries
5.2.1.3 Technological Advancements in Molecular Spectroscopy Systems
5.2.1.4 Growing Focus on Ensuring the Quality of Food Products
5.2.2 Restraints
5.2.2.1 High Cost of Molecular Spectroscopy Systems
5.2.3 Opportunities
5.2.3.1 Growing Opportunities in Emerging Markets
5.2.3.2 Potential Applications of Terahertz Spectroscopy in Healthcare
5.2.4 Challenges
5.2.4.1 Dearth of Skilled Professionals
6 Global Molecular Spectroscopy Market, By Technology (Page No. - 46)
6.1 Introduction
6.2 Nuclear Magnetic Resonance Spectroscopy
6.2.1 Fourier-Transform NMR Spectroscopy
6.2.2 Continuous-Wave NMR Spectroscopy
6.2.3 Solid-State NMR Spectroscopy
6.3 Uv-Visible Spectroscopy
6.3.1 Single-Beam Uv-Visible Spectroscopy
6.3.2 Dual-Beam Uv-Visible Spectroscopy
6.3.3 Array-Based Uv-Visible Spectroscopy
6.4 Infrared Spectroscopy
6.4.1 Infrared Spectroscopy Market, By Spectrum
6.4.1.1 Mid-Wave Infrared Spectroscopy
6.4.1.2 Short-Wave Infrared Spectroscopy
6.4.1.3 Far-Wave Infrared Spectroscopy
6.4.2 Infrared Spectroscopy Market, By Type
6.4.2.1 Benchtop
6.4.2.2 Infrared Microscopy
6.4.2.3 Portable & Handheld
6.4.2.4 Hyphenated
6.4.2.5 Terahertz
6.5 Near-Infrared Spectroscopy
6.5.1 Scanning Near-Infrared Spectroscopy
6.5.2 Fourier-Transform Near-Infrared Spectroscopy
6.5.3 Filter Nir Spectroscopy/Acoustic-Optical Tunable Filter-Nir Spectroscopy
6.6 Color Measurement Spectroscopy
6.7 Raman Spectroscopy
6.7.1 Raman Spectroscopy Market, By Sampling Technique
6.7.1.1 Surface-Enhanced Raman Scattering
6.7.1.2 Tip-Enhanced Raman Scattering
6.7.1.3 Other Raman Spectroscopy Techniques
6.7.2 Raman Spectroscopy Market, By Type
6.7.2.1 Micro-Raman Spectroscopy
6.7.2.2 Probe-Based Raman Spectroscopy
6.7.2.3 Ft-Raman Spectroscopy
6.8 Other Technologies
7 Molecular Spectroscopy Market, By Application (Page No. - 78)
7.1 Introduction
7.2 Pharmaceutical Applications
7.3 Food & Beverage Testing
7.4 Biotechnology & Biopharmaceutical Applications
7.5 Environmental Testing
7.6 Academic Research
7.7 Other Applications
8 Molecular Spectroscopy Market, By Region (Page No. - 87)
8.1 Introduction
8.2 North America
8.2.1 US
8.2.1.1 Growing Funding for Environmental Testing
8.2.1.2 Use of Molecular Spectroscopy in the Pharmaceutical Sector
8.2.1.3 Conferences on Analytical Technologies in the US
8.2.1.4 Growing Food Safety Concerns in the US
8.2.2 Canada
8.2.2.1 Growing Funding for Research and Infrastructural Development
8.3 Europe
8.3.1 Eu-5
8.3.1.1 Favorable Scenario of Biotechnology and Pharmaceutical Industry in Germany, Italy, and the UK
8.3.1.2 Conferences on Analytical Technologies in Germany
8.3.1.3 Changing Patterns of Food Production and Consumption in the UK
8.3.1.4 Focus of the Pharmaceutical Market Players to Enhance Their Presence in France
8.3.1.5 Funding From Venture Capitalists Driving the Life Sciences Sector in Spain
8.3.2 Rest of Europe (RoE)
8.3.2.1 Russia: Growth of the Pharmaceutical Industry
8.3.2.2 Rising Research Investments in Sweden, Austria, and Denmark
8.4 Asia Pacific
8.4.1 China
8.4.1.1 Growing Focus on Environment Protection
8.4.1.2 Thriving Biotechnology Market in China
8.4.2 Japan
8.4.2.1 Growth in Biomedical and Medical Research in Japan
8.4.2.2 Conferences and Symposia
8.4.3 India
8.4.3.1 Growth of the Indian Food Industry, Rising Food Safety Concerns
8.4.4 Rest of Asia Pacific
8.4.4.1 Growing Molecular Diagnostics Testing in RoAPAC Countries
8.4.4.2 Federal Collaborations in Australia
8.5 Rest of the World (RoW)
8.5.1 Growing Awareness About Food Safety in the UAE
8.5.2 Funding for the Biotechnology & Pharmaceutical Industries in Brazil
8.5.3 Increasing Focus of Pharmaceutical Companies on Africa
9 Competitive Landscape (Page No. - 150)
9.1 Overview
9.2 Market Share Analysis
9.3 Competitive Leadership Mapping (2017)
9.3.1 Visionary Leaders
9.3.2 Innovators
9.3.3 Dynamic Differentiators
9.3.4 Emerging Companies
9.4 Competitive Benchmarking
9.4.1 Strength of Product Portfolio (25 Companies)
9.4.2 Business Strategy Excellence (25 Companies)
*Top 25 Companies Analyzed for This Study are - Bruker Corporation (US), Thermo Fisher Scientific, Inc. (U.S), Perkinelmer, Inc. (US), Agilent Technologies, Inc. (US), Shimadzu Corporation (Japan), Danaher Corporation (US), ABB (Switzerland), Merck KAaG (Germany), Jeol Ltd. (Japan), Foss (Denmark), Jasco, Inc. (US), Horiba Ltd. (US), Sgs Malaysia Sdn Bhd (Malaysia), Analytik Jena Ag (Germany), Ocean Optics, Inc. (US), Metrohm Ag (Switzerland), B&W Tek Inc. (US), Hitachi Ltd.(Japan), Bayspec, Inc. (US), Advantest Corporation (Japan), Gasmet Technologies Oy (Finland), Buchi Corporation (US), Specac Ltd. (UK), Avantes Bv (Netherlands), Oxford Instruments (UK),
10 Company Profiles (Page No. - 155)
(Overview, Products Offered, Strength of Product Portfolio, Business Strategy Excellence, Recent Developments.)*
10.1 Bruker Corporation
10.1.1 Business Overview
10.1.2 Products Offered
10.1.3 Recent Developments
10.2 Thermo Fisher Scientific, Inc.
10.2.1 Business Overview
10.2.2 Products Offered
10.2.3 Recent Developments
10.3 Perkinelmer, Inc.
10.3.1 Business Overview
10.3.2 Products Offered
10.3.3 Recent Developments
10.4 Agilent Technologies, Inc.
10.4.1 Business Overview
10.4.2 Products Offered
10.4.3 Recent Developments
10.5 Shimadzu Corporation
10.5.1 Business Overview
10.5.2 Products Offered
10.5.3 Recent Developments
10.6 Danaher Corporation
10.6.1 Business Overview
10.6.2 Products Offered
10.6.3 Recent Developments
10.7 ABB
10.8 Merck KAaG
10.9 Jeol Ltd.
10.10 Jasco, Inc.
10.11 Foss
10.12 Horiba, Ltd.
*Details on Overview,S Strength of Product Portfolio, Business Strategy Excellence, Recent Developments, Key Relationships Might Not Be Captured in Case of Unlisted Companies.
11 Appendix (Page No. - 203)
11.1 Insights of Industry Experts
11.2 Discussion Guide
11.3 Knowledge Store: Marketsandmarkets� Subscription Portal
11.4 Introducing Rt: Real-Time Market Intelligence
11.5 Available Customizations
11.6 Related Reports
11.7 Author Details
List of Tables (161 Tables)
Table 1 Molecular Spectroscopy Market, By Technology, 2015�2022 (USD Million)
Table 2 NMR Spectroscopy Market, By Type, 2015�2022 (USD Million)
Table 3 NMR Spectroscopy Market, By Region, 2015�2022 (USD Million)
Table 4 Ft-NMR Spectroscopy Market, By Region, 2015�2022 (USD Million)
Table 5 Cw-NMR Spectroscopy Market, By Region, 2015�2022 (USD Million)
Table 6 Solid-State NMR Spectroscopy Market, By Region, 2015�2022 (USD Million)
Table 7 Uv-Visible Spectroscopy Market, By Type, 2015�2022 (USD Million)
Table 8 Uv-Visible Spectroscopy Market, By Region, 2015�2022 (USD Million)
Table 9 Single-Beam Uv-Visible Spectroscopy Market, By Region, 2015�2022 (USD Million)
Table 10 Dual-Beam Uv-Visible Spectroscopy Market, By Region, 2015�2022 (USD Million)
Table 11 Array-Based Uv-Visible Spectroscopy Market, By Region, 2015�2022 (USD Million)
Table 12 Infrared Spectroscopy Market, By Region, 2015�2022 (USD Million)
Table 13 Infrared Spectroscopy Market, By Spectrum, 2015�2022 (USD Million)
Table 14 Mid-Wave Infrared Spectroscopy Market, By Region, 2015�2022 (USD Million)
Table 15 Short-Wave Infrared Spectroscopy Market, By Region, 2015�2022 (USD Million)
Table 16 Far-Wave Infrared Spectroscopy Market, By Region, 2015�2022 (USD Million)
Table 17 Infrared Spectroscopy Market, By Type, 2015�2022 (USD Million)
Table 18 Benchtop Infrared Spectroscopy Market, By Region, 2015�2022 (USD Million)
Table 19 Infrared Microscopy Market, By Region, 2015�2022 (USD Million)
Table 20 Portable & Handheld Infrared Spectroscopy Market, By Region, 2015�2022 (USD Million)
Table 21 Hyphenated Infrared Spectroscopy Market, By Region, 2015�2022 (USD Million)
Table 22 Terahertz Spectroscopy Market, By Region, 2015�2022 (USD Million)
Table 23 Near-Infrared Spectroscopy Market, By Type, 2015�2022 (USD Million)
Table 24 Near-Infrared Spectroscopy Market, By Region, 2015�2022 (USD Million)
Table 25 Scanning Near-Infrared Spectroscopy Market, By Region, 2015�2022 (USD Million)
Table 26 Fourier-Transform Near-Infrared Spectroscopy Market, By Region, 2015�2022 (USD Million)
Table 27 Aotf-Nir Spectroscopy Market, By Region, 2015�2022 (USD Million)
Table 28 Color Measurement Spectroscopy Market, By Region, 2015�2022 (USD Million)
Table 29 Raman Spectroscopy Market, By Region, 2015�2022 (USD Million)
Table 30 Raman Spectroscopy Market, By Sampling Technique, 2015�2022 (USD Million)
Table 31 Surface-Enhanced Raman Scattering Market, By Region, 2015�2022 (USD Million)
Table 32 Tip-Enhanced Raman Scattering Market, By Region, 2015�2022 (USD Million)
Table 33 Other Raman Spectroscopy Techniques Market, By Region, 2015�2022 (USD Million)
Table 34 Raman Spectroscopy Market, By Type, 2015�2022 (USD Million)
Table 35 Micro-Raman Spectroscopy Market, By Region, 2015�2022 (USD Million)
Table 36 Probe-Based Raman Spectroscopy Market, By Region, 2015�2022 (USD Million)
Table 37 Ft-Raman Spectroscopy Market, By Region, 2015�2022 (USD Million)
Table 38 Other Molecular Spectros Orcopy Technologies Market, By Region, 2015�2022 (USD Million)
Table 39 Molecular Spectroscopy Market, By Application, 2015�2022 (USD Million)
Table 40 Market for Pharmaceutical Applications, By Region, 2015�2022 (USD Million)
Table 41 Market for Food & Beverage Testing, By Region, 2015�2022 (USD Million)
Table 42 Market for Biotechnology and Biopharmaceutical Applications, By Region, 2015�2022 (USD Million)
Table 43 Market for Environmental Testing, By Region, 2015�2022 (USD Million)
Table 44 Market for Academic Research, By Region, 2015�2022 (USD Million)
Table 45 Market for Other Applications, By Region, 2015�2022 (USD Million)
Table 46 Market, By Region, 2015�2022 (USD Million)
Table 47 North America: Molecular Spectroscopy Market, By Country, 2015�2022 (USD Million)
Table 48 North America: Market, By Technology,2015�2022 (USD Million)
Table 49 North America: NMR Spectroscopy Market, By Type, 2015�2022 (USD Million)
Table 50 North America: Uv-Visible Spectroscopy Market, By Type, 2015�2022 (USD Million)
Table 51 North America: Infrared Spectroscopy Market, By Spectrum, 2015�2022 (USD Million)
Table 52 North America: Infrared Spectroscopy Market, By Instrument, 2015�2022 (USD Million)
Table 53 North America: Near-Infrared Spectroscopy Market, By Type, 2015�2022 (USD Million)
Table 54 North America: Raman Spectroscopy Market, By Sampling Technique, 2015�2022 (USD Million)
Table 55 North America: Raman Spectroscopy Market, By Type, 2015�2022 (USD Million)
Table 56 North America: Molecular Spectroscopy Market, By Application, 2015�2022 (USD Million)
Table 57 Conferences/Symposiums/Workshops/Meetings on Analytical Technologies in the Us (2014�2017)
Table 58 US: Market, By Technology, 2015�2022 (USD Million)
Table 59 US: NMR Spectroscopy Market, By Type, 2015�2022 (USD Million)
Table 60 US: Uv-Visible Spectroscopy Market, By Type, 2015�2022 (USD Million)
Table 61 US: Infrared Spectroscopy Market, By Spectrum, 2015�2022 (USD Million)
Table 62 US: Infrared Spectroscopy Market, By Instrument, 2015�2022 (USD Million)
Table 63 US: Near-Infrared Spectroscopy Market, By Type, 2015�2022 (USD Million)
Table 64 US: Raman Spectroscopy Market, By Sampling Technique, 2015�2022 (USD Million)
Table 65 US: Raman Spectroscopy Market, By Type, 2015�2022 (USD Million)
Table 66 US: Molecular Spectroscopy Market, By Application, 2015�2022 (USD Million)
Table 67 Canada: Market, By Technology, 2015�2022 (USD Million)
Table 68 Canada: NMR Spectroscopy Market, By Type, 2015�2022 (USD Million)
Table 69 Canada: Uv-Visible Spectroscopy Market, By Type, 2015�2022 (USD Million)
Table 70 Canada: Infrared Spectroscopy Market, By Spectrum, 2015�2022 (USD Million)
Table 71 Canada: Infrared Spectroscopy Market, By Instrument, 2015�2022 (USD Million)
Table 72 Canada: Near-Infrared Spectroscopy Market, By Type, 2015�2022 (USD Million)
Table 73 Canada: Raman Spectroscopy Market, By Sampling Technique, 2015�2022 (USD Million)
Table 74 Canada: Raman Spectroscopy Market, By Type, 2015�2022 (USD Million)
Table 75 Canada: Molecular Spectroscopy Market, By Application, 2015�2022 (USD Million)
Table 76 Europe: Market, By Region, 2015�2022 (USD Million)
Table 77 Europe: Market, By Technology, 2015�2022 (USD Million)
Table 78 Europe: NMR Spectroscopy Market, By Type, 2015�2022 (USD Million)
Table 79 Europe: Uv-Visible Spectroscopy Market, By Type, 2015�2022 (USD Million)
Table 80 Europe: Infrared Spectroscopy Market, By Spectrum, 2015�2022 (USD Million)
Table 81 Europe: Infrared Spectroscopy Market, By Instrument, 2015�2022 (USD Million)
Table 82 Europe: Near-Infrared Spectroscopy Market, By Type, 2015�2022 (USD Million)
Table 83 Europe: Raman Spectroscopy Market, By Sampling Technique, 2015�2022 (USD Million)
Table 84 Europe: Raman Spectroscopy Market, By Type, 2015�2022 (USD Million)
Table 85 Europe: Molecular Spectroscopy Market, By Application, 2015�2022 (USD Million)
Table 86 Conferences/Meetings/Exhibitions/Symposiums on Analytical Technologies in Germany (2014-2017)
Table 87 Eu-5: Market, By Technology, 2015�2022 (USD Million)
Table 88 Eu-5: NMR Spectroscopy Market, By Type, 2015�2022 (USD Million)
Table 89 Eu-5: Uv-Visible Spectroscopy Market, By Type, 2015�2022 (USD Million)
Table 90 Eu-5: Infrared Spectroscopy Market, By Spectrum, 2015�2022 (USD Million)
Table 91 Eu-5: Infrared Spectroscopy Market, By Instrument, 2015�2022 (USD Million)
Table 92 Eu-5: Near-Infrared Spectroscopy Market, By Type, 2015�2022 (USD Million)
Table 93 Eu-5: Raman Spectroscopy Market, By Sampling Technique, 2015�2022 (USD Million)
Table 94 Eu-5: Raman Spectroscopy Market, By Type, 2015�2022 (USD Million)
Table 95 Eu-5: Molecular Spectroscopy Market, By Application, 2015�2022 (USD Million)
Table 96 RoE: Market, By Technology, 2015�2022 (USD Million)
Table 97 RoE: NMR Spectroscopy Market, By Type, 2015�2022 (USD Million)
Table 98 RoE: Uv-Visible Spectroscopy Market, By Type, 2015�2022 (USD Million)
Table 99 RoE: Infrared Spectroscopy Market, By Spectrum, 2015�2022 (USD Million)
Table 100 RoE: Infrared Spectroscopy Market, By Instrument, 2015�2022 (USD Million)
Table 101 RoE: Near-Infrared Spectroscopy Market, By Type, 2015�2022 (USD Million)
Table 102 RoE: Raman Spectroscopy Market, By Sampling Technique, 2015�2022 (USD Million)
Table 103 RoE: Raman Spectroscopy Market, By Type, 2015�2022 (USD Million)
Table 104 RoE: Molecular Spectroscopy Market, By Application, 2015�2022 (USD Million)
Table 105 Asia Pacific: Molecular Spectroscopy Market, By Country, 2015�2022 (USD Million)
Table 106 Asia Pacific: Market, By Technology, 2015�2022 (USD Million)
Table 107 Asia Pacific: NMR Spectroscopy Market, By Type, 2015�2022 (USD Million)
Table 108 Asia Pacific: Uv-Visible Spectroscopy Market, By Type, 2015�2022 (USD Million)
Table 109 Asia Pacific: Infrared Spectroscopy Market, By Spectrum, 2015�2022 (USD Million)
Table 110 Asia Pacific: Infrared Spectroscopy Market, By Instrument, 2015�2022 (USD Million)
Table 111 Asia Pacific: Near-Infrared Spectroscopy Market, By Type, 2015�2022 (USD Million)
Table 112 Asia Pacific: Raman Spectroscopy Market, By Sampling Technique, 2015�2022 (USD Million)
Table 113 Asia Pacific: Raman Spectroscopy Market, By Type, 2015�2022 (USD Million)
Table 114 Asia Pacific: Molecular Spectroscopy Market, By Application, 2015�2022 (USD Million)
Table 115 China: Market, By Technology, 2015�2022 (USD Million)
Table 116 China: NMR Spectroscopy Market, By Type, 2015�2022 (USD Million)
Table 117 China: Uv-Visible Spectroscopy Market, By Type, 2015�2022 (USD Million)
Table 118 China: Infrared Spectroscopy Market, By Spectrum, 2015�2022 (USD Million)
Table 119 China: Infrared Spectroscopy Market, By Instrument, 2015�2022 (USD Million)
Table 120 China: Near-Infrared Spectroscopy Market, By Type, 2015�2022 (USD Million)
Table 121 China: Raman Spectroscopy Market, By Sampling Technique, 2015�2022 (USD Million)
Table 122 China: Raman Spectroscopy Market, By Type, 2015�2022 (USD Million)
Table 123 China: Molecular Spectroscopy Market, By Application, 2015�2022 (USD Million)
Table 124 Conferences/Meetings/Symposiums/Workshops in Japan (2014�2017)
Table 125 Japan: Molecular Spectroscopy Market, By Technology, 2015�2022 (USD Million)
Table 126 Japan: NMR Spectroscopy Market, By Type, 2015�2022 (USD Million)
Table 127 Japan: Uv-Visible Spectroscopy Market, By Type, 2015�2022 (USD Million)
Table 128 Japan: Infrared Spectroscopy Market, By Spectrum, 2015�2022 (USD Million)
Table 129 Japan: Infrared Spectroscopy Market, By Instrument, 2015�2022 (USD Million)
Table 130 Japan: Near-Infrared Spectroscopy Market, By Type, 2015�2022 (USD Million)
Table 131 Japan: Raman Spectroscopy Market, By Sampling Technique, 2015�2022 (USD Million)
Table 132 Japan: Raman Spectroscopy Market, By Type, 2015�2022 (USD Million)
Table 133 Japan: Molecular Spectroscopy Market, By Application, 2015�2022 (USD Million)
Table 134 India: Molecular Spectroscopy Market, By Technology, 2015�2022 (USD Million)
Table 135 India: NMR Spectroscopy Market, By Type, 2015�2022 (USD Million)
Table 136 India: Uv-Visible Spectroscopy Market, By Type, 2015�2022 (USD Million)
Table 137 India: Infrared Spectroscopy Market, By Spectrum, 2015�2022 (USD Million)
Table 138 India: Infrared Spectroscopy Market, By Instrument, 2015�2022 (USD Million)
Table 139 India: Near-Infrared Spectroscopy Market, By Type, 2015�2022 (USD Million)
Table 140 India: Raman Spectroscopy Market, By Sampling Technique, 2015�2022 (USD Million)
Table 141 India: Raman Spectroscopy Market, By Type, 2015�2022 (USD Million)
Table 142 India: Molecular Spectroscopy Market, By Application, 2015�2022 (USD Million)
Table 143 RoAPAC: Market, By Technology, 2015�2022 (USD Million)
Table 144 RoAPAC: NMR Spectroscopy Market, By Type, 2015�2022 (USD Million)
Table 145 RoAPAC: Uv-Visible Spectroscopy Market, By Type, 2015�2022 (USD Million)
Table 146 RoAPAC: Infrared Spectroscopy Market, By Spectrum, 2015�2022 (USD Million)
Table 147 RoAPAC: Infrared Spectroscopy Market, By Instrument, 2015�2022 (USD Million)
Table 148 RoAPAC: Near-Infrared Spectroscopy Market, By Type, 2015�2022 (USD Million)
Table 149 RoAPAC: Raman Spectroscopy Market, By Sampling Technique, 2015�2022 (USD Million)
Table 150 RoAPAC: Raman Spectroscopy Market, By Type, 2015�2022 (USD Million)
Table 151 RoAPAC: Molecular Spectroscopy Market, By Application, 2015�2022 (USD Million)
Table 152 Conferences/Meetings/Symposiums/Workshops in UAE (2014�2017)
Table 153 RoW: Market, By Technology, 2015�2022 (USD Million)
Table 154 RoW: NMR Spectroscopy Market, By Type, 2015�2022 (USD Million)
Table 155 RoW: Uv-Visible Spectroscopy Market, By Type, 2015�2022 (USD Million)
Table 156 RoW: Infrared Spectroscopy Market, By Spectrum, 2015�2022 (USD Million)
Table 157 RoW: Infrared Spectroscopy Market, By Instrument, 2015�2022 (USD Million)
Table 158 RoW: Near-Infrared Spectroscopy Market, By Type, 2015�2022 (USD Million)
Table 159 RoW: Raman Spectroscopy Market, By Sampling Technique, 2015�2022 (USD Million)
Table 160 RoW: Raman Spectroscopy Market, By Type, 2015�2022 (USD Million)
Table 161 RoW: Molecular Spectroscopy Market, By Application, 2015�2022 (USD Million)
List of Figures (34 Figures)
Figure 1 Global Molecular Spectroscopy Market: Research Methodology Steps
Figure 2 Sampling Frame: Primary Research
Figure 3 Breakdown of Primary Interviews
Figure 4 Market Size Estimation Methodology: Bottom-Up Approach
Figure 5 Market Size Estimation Methodology: Top-Down Approach
Figure 6 Research Design
Figure 7 Data Triangulation Methodology
Figure 8 Raman Spectroscopy Segment to Register the Highest CAGR in the Global Molecular Spectroscopy Market, By Technology, Between 2017 & 2022
Figure 9 Pharmaceuticals Segment to Register the Highest Growth in the Global Market, By Application, Between 2017 & 2022
Figure 10 Geographical Snapshot of the Global Market
Figure 11 Rising Adoption of Molecular Spectroscopy in Pharmaceutical and Environmental Analysis Will Drive Market Growth
Figure 12 NMR Segment Will Continue to Dominate the Molecular Spectroscopy Market in 2022
Figure 13 Pharmaceutical Applications to Account for the Largest Market Share in 2022
Figure 14 Asia Pacific to Register the Highest Growth in the Forecast Period
Figure 15 Molecular Spectroscopy Market: Drivers, Restraints, Opportunities, and Challenges
Figure 16 NMR Spectroscopy Segment to Dominate the Molecular Spectroscopy Market in 2017
Figure 17 Pharmaceutical Applications Segment to Grow at the Highest CAGR During the Forecast Period
Figure 18 North America to Account for the Largest Share of the Global Molecular Spectroscopy Market, 2017
Figure 19 North America: Molecular Spectroscopy Market Snapshot
Figure 20 Europe: Market Snapshot
Figure 21 Asia Pacific: Market Snapshot
Figure 22 RoW: Molecular Spectroscopy Market Snapshot
Figure 23 Global Market Share Analysis, By Key Player, 2016
Figure 24 Market (Global) Competitive Leadership Mapping, 2017
Figure 25 Bruker Corporation: Company Snapshot (2016)
Figure 26 Thermo Fisher Scientific, Inc.: Company Snapshot (2016)
Figure 27 Perkinelmer, Inc.: Company Snapshot (2016)
Figure 28 Agilent Technologies, Inc.: Company Snapshot (2016)
Figure 29 Shimadzu Corporation: Company Snapshot (2016)
Figure 30 Danaher Corporation: Company Snapshot
Figure 31 ABB: Company Snapshot (2016)
Figure 32 Merck KAaG: Company Snapshot (2016)
Figure 33 Jeol Ltd.: Company Snapshot (2016)
Figure 34 Horiba, Ltd.: Company Snapshot (2016)

 Generating Response ...


Growth opportunities and latent adjacency in Molecular Spectroscopy Market