Smart Pole Market by Offering (Component, Software, and Services), Installation Type (New Installation and Retrofit), Application (Highways & Roadways, Public Places, and Railways & Harbors), and Geography - Global Forecast to 2023


[140 Pages Report] The global smart pole market is expected to be worth USD 16.65 Billion by 2023 from USD 4.92 Billion in 2016, growing at a CAGR of 19.99% between 2017 and 2023.
The years considered for the study are as follows:
- Base year: 2016
- Projected year: 2023
- Forecast period: 2017�2023
The following are the major objectives of the study:
- To define, describe, and forecast the smart pole market on the basis of offering, installation type, application, and geography
- To provide detailed information regarding the major factors influencing the growth of the market (drivers, restraints, opportunities, and challenges)
- To analyze the opportunities in the market for stakeholders by identifying the high-growth segments of the market
- To strategically analyze the micromarkets with respect to individual growth trends, prospects, and contribution to the total market
- To forecast the market size, in terms of value, for various segments, with regard to four main regions: North America, Europe, Asia Pacific (APAC), and Rest of the World (RoW)
- To strategically profile the key players and comprehensively analyze their market share and core competencies, along with detailing the competitive landscape for market leaders
- To analyze the competitive developments such as joint ventures, mergers and acquisitions, product developments, and research and development (R&D) carried out in the market
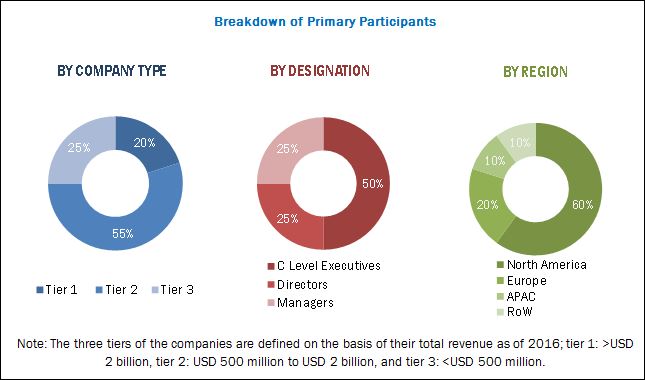
During this research study, the major players operating in the smart pole market in various regions have been identified, and their offerings, regional presence, and distribution channels have been analyzed through in-depth discussions. Top-down and bottom-up approaches have been used to determine the overall market size. The percentage splits obtained using secondary sources, such as Hoovers, Bloomberg BusinessWeek, Factiva, and One Source have been used, along with primary respondents to estimate the sizes of other individual markets. The entire procedure includes the study of the annual and financial reports of the top market players and extensive interviews with industry experts such as CEOs, VPs, directors, and marketing executives for key insights (both qualitative and quantitative) pertaining to the market. The figure below shows the breakdown of the primaries on the basis of the company type, designation, and region conducted during the research study.
To know about the assumptions considered for the study, download the pdf brochure
The smart pole market comprises a network of research and product development, raw material supply, component manufacturing, key technology provider/system integrator, distribution and sale, and post-sales services. The key players considered in the study of the market are Philips Lighting Holding B.V. (Netherlands), General Electric (US), Hubbell Incorporated (US), Cree, Inc. (US), Eaton Corporation (Ireland), Acuity Brands (US), Zumtobel Group (Austria), SYSKA LED (India), Neptun Light Inc. (US), Maven Systems Pvt. Ltd. (India), Lumca Inc. (Canada), Sunna Design (France), Mobile Pro Systems (US), Goldspar Australia Pty Ltd. (Australia), and Virtual Extension Ltd. (Israel).
Target Audience:
- Smart pole products and solutions providers
- Smart pole-related service providers
- Smart pole materials and accessories providers
- Smart pole consulting companies
- Smart pole assembly companies
- Smart pole-related associations, organizations, forums, and alliances
- Governments and corporate offices
- Venture capitalists, private equity firms, and start-up companies
- Distributors and traders
- End users
Report Scope:
By Offering:
- Component
- Lighting Lamp
- Light-Emitting Diode (LED) Lamp
- Fluorescent Lamp
- High-Intensity Discharge (HID) Lamp
- Pole Bracket and Pole Body
- Communication Device
- Ballast
- Lamp Controller
- Others (Sensor, Camera, Speaker, EV Charger)
- Lighting Lamp
- Software
- Services
- Installation
- Maintenance
By Installation Type:
- New Installation
- Retrofit
By Application:
- Highways and Roadways
- Public Places
- Railways and Harbors
By Geography:
- North America
- Europe
- APAC
- RoW
Available Customizations:
With the given market data, MarketsandMarkets offers customizations according to the client�s specific needs. The following customization options are available for the report:
Geographic Analysis
- Further analysis of the smart pole market for additional countries
Company Information
- Detailed analysis and profiling of other smart pole companies (up to five)
Get more insight on other verticals of Semiconductor and Electronics Market Research Reports & Consulting
The smart pole market is expected to be valued at USD 16.65 Billion by 2023, growing at a CAGR of 19.99% between 2017 and 2023. Some of the key factors driving the growth of this market are the need for energy-efficient pole lighting systems, increasing government initiatives for smart cities, and advantage of preventing traffic jams and accidents.
The smart pole system has various advantages over conventional street lights such as reduced maintenance costs, real-time reports and controllability, less environmental impact, etc. The smart pole could be seen as a revolution in the street pole industry and would create ample opportunities for the players operating in the field of smart devices, street light systems, internet connectivity, and communication devices, among others, in the coming years.
The smart pole market for software is expected to grow at the highest CAGR between 2017 and 2023. Software includes all the software solutions such that are integrated into the smart pole to make it connected and enable it to transfer and manage information. The basic feature of software used in any lighting system is the ability to control the functionality of the light. Some of the functions of the smart lighting software are daylight saving, real-time monitoring, alarms for street and other outdoor lights, dimming control, energy savings, intelligent dispatching, intuitive programming, scheduling of lighting functions, and analytics and reporting. The increasing interconnectivity of devices would create a demand for more robust software solutions. Thus, the market for the software solution is expected to grow at the highest rate during the forecast period.
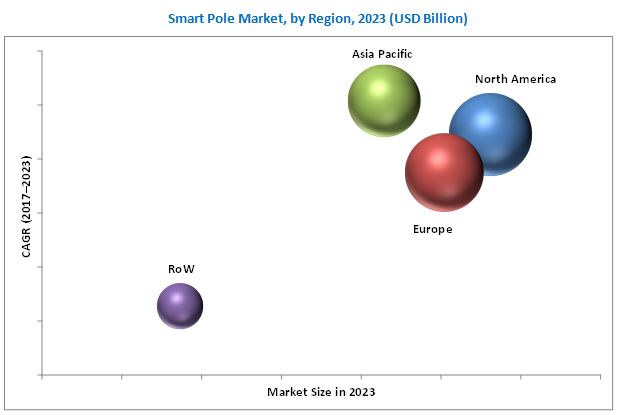
North America is expected to hold the largest size of the smart pole market in 2016, and the market in APAC is expected to grow at the highest CAGR between 2017 and 2023. The early adoption of smart pole system in the US where a huge number of projects are being undertaken either for retrofitting smart poles or new installations is the main driving factor for the largest market size in North America. The market in APAC is expected to grow at the highest rate because of the increasing government initiatives in countries such as China, India, Japan, and Australia to expedite the replacement of traditional pole systems with smart pole systems to reduce the load of energy consumption by the street lights by 40%.
The major factor restraining the growth of the market is the higher upfront cost compared to traditional poles. Street and roadway lighting is an important service provided by public authorities at municipal and local levels, and efficient lighting is essential for urban ambience, road safety, and personal safety. Smart poles can save costs over the long term by reducing the energy consumption of street lighting and offering other facilities such as electric vehicle charging, pollution sensors, and Wi-Fi connectivity, among others, in a single device. However, the initial installation cost of the implementation and equipment is very high. Numerous factors determine the cost of installing street lighting, such as the source type, wattage type, and location. Moreover, the installation of smart pole needs various hardware components such as dimmers, sensors, communication devices, and control systems, as well as software. All these components significantly increase the cost involved in the installation of smart poles compared to conventional poles because of the high cost of software and control systems required in smart poles. This factor hampers the large-scale adoption of smart poles. On the other hand, factors such as the reducing prices of LEDs and high return on investment (ROI) of smart lighting in the long run are expected to lessen the impact of this restraint in the future.
The key players in the market include Philips Lighting Holding B.V. (Netherlands), GE Lighting Co. Ltd (US), Hubbell Incorporated (US), Cree, Inc. (US), Eaton Corporation (Ireland), Acuity Brands (US). The companies in the market are strengthening their product portfolios by increasing their R&D investments. The key players in this market are increasingly undertaking partnerships and collaborations, and new product developments and launches to develop new technologies and appliances in the market.
To speak to our analyst for a discussion on the above findings, click Speak to Analyst
Table of Contents
1 Introduction (Page No. - 13)
1.1 Objectives of the Study
1.2 Definition
1.3 Study Scope
1.3.1 Markets Covered
1.3.2 Years Considered for the Study
1.4 Currency
1.5 Limitations
1.6 Stakeholders
2 Research Methodology (Page No. - 16)
2.1 Research Data
2.1.1 Secondary Data
2.1.1.1 Key Data From Secondary Sources
2.1.2 Primary Data
2.1.2.1 Key Data From Primary Source
2.1.2.2 Breakdown of Primaries
2.1.2.3 Key Industry Insights
2.2 Market Size Estimation
2.3 Market Breakdown and Data Triangulation
2.4 Research Assumptions
3 Executive Summary (Page No. - 25)
4 Premium Insights (Page No. - 29)
4.1 Smart Pole Market
4.2 Market in North America, By Installation (2017�2023)
4.3 North America Smart Pole Market, By Application and Geography (2017)
4.4 Market, By Offering (2017�2023)
4.5 Market, By Geography (2017�2023)
5 Market Overview (Page No. - 32)
5.1 Introduction
5.2 Market Dynamics
5.2.1 Drivers
5.2.1.1 Need for Energy-Efficient Pole Lighting Systems
5.2.1.2 Increasing Government Initiatives for Smart Cities
5.2.1.3 Advantage in Reducing Traffic Jams and Preventing Accidents
5.2.2 Restraints
5.2.2.1 Higher Upfront Cost Compared to Traditional Poles
5.2.3 Opportunities
5.2.3.1 Use of IoT Technology in Smart Poles
5.2.3.2 Demand for Energy Efficiency in Developing Economies
5.2.4 Challenges
5.2.4.1 Lack of Standardization of Communication Protocols
6 Industry Trends (Page No. - 37)
6.1 Introduction
6.2 Value Chain Analysis
6.2.1 Research & Product Development
6.2.2 Raw Material Supply
6.2.3 Component Manufacturing
6.2.4 Key Technology Provider/System Integrator
6.2.5 Distribution and Sale
6.2.6 Post�Sales Service
6.3 Key Industry Trends
7 Smart Pole Market, By Offering (Page No. - 40)
7.1 Introduction
7.2 Component
7.2.1 Lighting Lamp
7.2.1.1 Light-Emitting Diode (LED) Lamp
7.2.1.2 Fluorescent Lamp
7.2.1.3 High-Intensity Discharge (HID) Lamp
7.2.2 Pole Bracket and Pole Body
7.2.3 Communication Device
7.2.4 Ballast
7.2.5 Lamp Controller
7.2.6 Others
7.3 Software
7.4 Services
7.4.1 Installation
7.4.2 Maintenance
8 Smart Pole Market, By Installation Type (Page No. - 48)
8.1 Introduction
8.2 New Installation
8.3 Retrofit Installation
9 Smart Pole Market, By Application (Page No. - 53)
9.1 Introduction
9.2 Highways and Roadways
9.3 Public Places
9.4 Railways and Harbors
10 Geographic Analysis (Page No. - 59)
10.1 Introduction
10.2 North America
10.2.1 US
10.2.2 Canada
10.2.3 Mexico
10.3 Europe
10.3.1 UK
10.3.2 Germany
10.3.3 France
10.3.4 Spain
10.3.5 Italy
10.3.6 Rest of Europe
10.4 APAC
10.4.1 China
10.4.2 Japan
10.4.3 India
10.4.4 Australia
10.4.5 South Korea
10.4.6 Rest of APAC
10.5 RoW
10.5.1 Middle East
10.5.2 South America
10.5.3 Africa
11 Competitive Landscape (Page No. - 94)
11.1 Overview
11.2 Market Ranking Analysis
11.3 Competitive Situations and Trends
11.4 Significant Developments in Smart Pole Market
12 Company Profiles (Page No. - 99)
(Business Overview, Products Offered, Product Offering Scorecard, Business Strategy Scorecard, Recent Developments, Key Relationships)*
12.1 Introduction
12.2 Philips Lighting Holding B.V.
12.3 General Electric Company
12.4 Hubbell Incorporated
12.5 Cree, Inc.
12.6 Eaton Corporation PLC
12.7 Acuity Brands, Inc.
12.8 Zumtobel Group AG
12.9 Syska LED Lights Private Limited
12.10 Virtual Extension Ltd.
12.11 Mobile Pro Systems
12.12 Key Innovators
12.12.1 Neptun Light, Inc.
12.12.2 Shanghai Sansi Technology Co., Ltd.
12.12.3 Maven Systems Pvt. Ltd.
12.12.4 Goldspar Australia Private Limited
12.12.5 Sunna Design
12.12.6 Lumca Inc.
*Details on Business Overview, Products Offered, Product Offering Scorecard, Business Strategy Scorecard, Recent Developments, Key Relationships Might Not Be Captured in Case of Unlisted Companies.
13 Appendix (Page No. - 132)
13.1 Insights From Industry Experts
13.2 Discussion Guide
13.3 Knowledge Store: Marketsandmarkets� Subscription Portal
13.4 Introducing RT: Real-Time Market Intelligence
13.5 Available Customization
13.6 Related Reports
13.7 Author Details
List of Tables (65 Tables)
Table 1 Smart Pole Market, By Offering, 2015�2023 (USD Billion)
Table 2 Market for Lighting Lamps, 2015�2023 (USD Million)
Table 3 Market for Components, 2015�2023 (USD Million)
Table 4 Market for Services, 2015�2023 (USD Million)
Table 5 Market, By Installation Type, 2015�2023 (Million Units)
Table 6 Market, By Installation Type, 2015�2023 (USD Billion )
Table 7 Market for New Installation, By Region, 2015�2023 (USD Billion)
Table 8 Market for New Installation, By Region, 2015�2023 (USD Billion)
Table 9 Market, By Application, 2015�2023 (USD Million)
Table 10 Market for Highways and Roadways, By Region, 2015�2023 (USD Million)
Table 11 Market for Public Places, By Region, 2015�2023 (USD Million)
Table 12 Market for Railways and Harbors Application, By Region, 2015�2023 (USD Million)
Table 13 Smart Pole Market, By Region, 2015�2023 (USD Billion)
Table 14 Market in North America, By Application, 2015�2023 (USD Million)
Table 15 Market in North America, By Installation Type, 2015�2023 (USD Million)
Table 16 Market in North America, By Country, 2015�2023 (USD Million)
Table 17 Market in US, By Application, 2015�2023 (USD Million)
Table 18 Market in US, By Installation Type, 2015�2023 (USD Million)
Table 19 Market in Canada, By Application, 2015�2023 (USD Million)
Table 20 Market in Canada, By Installation Type, 2015�2023 (USD Million)
Table 21 Market in Mexico, By Application, 2015�2023 (USD Million)
Table 22 Market in Mexico, By Installation Type, 2015�2023 (USD Million)
Table 23 Market in Europe, By Application, 2015�2023 (USD Million)
Table 24 Market in Europe, By Installation Type, 2015�2023 (USD Million)
Table 25 Market in Europe, By Country 2015�2023 (USD Million)
Table 26 Market in UK, By Application, 2015�2023 (USD Million)
Table 27 Market in UK, By Installation Type, 2015�2023 (USD Million)
Table 28 Market in Germany, By Application, 2015�2023 (USD Million)
Table 29 Market in Germany, By Installation Type, 2015�2023 (USD Million)
Table 30 Market in France, By Application, 2015�2023 (USD Million)
Table 31 Market in France, By Installation Type, 2015�2023 (USD Million)
Table 32 Smart Pole Market in Spain, By Application, 2015�2023 (USD Million)
Table 33 Market in Spain, By Installation Type, 2015�2023 (USD Million)
Table 34 Market in Italy, By Application, 2015�2023 (USD Million)
Table 35 Market in Italy, By Installation Type, 2015�2023 (USD Million)
Table 36 Market in Rest of Europe, By Application, 2015�2023 (USD Million)
Table 37 Market in Rest of Europe, By Installation Type, 2015�2023 (USD Million)
Table 38 Market in APAC, By Application, 2015�2023 (USD Million)
Table 39 Market in APAC, By Installation Type, 2015�2023 (USD Million)
Table 40 Market in APAC, By Country 2015�2023 (USD Million)
Table 41 Smart Pole Market in China, By Application, 2015�2023 (USD Million)
Table 42 Market in China, By Installation Type, 2015�2023 (USD Million)
Table 43 Market in Japan, By Application, 2015�2023 (USD Million)
Table 44 Market in Japan, By Installation Type, 2015�2023 (USD Million)
Table 45 Market in India, By Application, 2015�2023 (USD Million)
Table 46 Market in India, By Installation Type, 2015�2023 (USD Million)
Table 47 Market in Australia, By Application, 2015�2023 (USD Million)
Table 48 Market in Australia, By Installation Type, 2015�2023 (USD Million)
Table 49 Market in South Korea, By Application, 2015�2023 (USD Million)
Table 50 Market in South Korea, By Installation Type, 2015�2023 (USD Million)
Table 51 Market in Rest of APAC, By Application, 2015�2023 (USD Million)
Table 52 Market in Rest of APAC, By Installation Type, 2015�2023 (USD Million)
Table 53 Market in RoW, By Application, 2015�2023 (USD Million)
Table 54 Market in RoW, By Installation Type, 2015�2023 (USD Million)
Table 55 Market in RoW, By Region, 2015�2023 (USD Million)
Table 56 Smart Pole Market in Middle East, By Application, 2015�2023 (USD Million)
Table 57 Market in Middle East, By Installation Type, 2015�2023 (USD Million)
Table 58 Market in South America, By Application, 2015�2023 (USD Million)
Table 59 Market in South America, By Installation Type, 2015�2023 (USD Million)
Table 60 Market in Africa, By Application, 2015�2023 (USD Million)
Table 61 Market in Africa, By Installation Type, 2015�2023 (USD Million)
Table 62 Market Ranking of the Top 5 Players in the Smart Pole Market
Table 63 New Product Development
Table 64 Agreement, Partnership and Collaboration
Table 65 Acquisitions
List of Figures (51 Figures)
Figure 1 Smart Pole Market
Figure 2 Geographic Scope
Figure 3 Process Flow: Market Size Estimation
Figure 4 Global Smart Pole Market: Research Design
Figure 5 Market Size Estimation Methodology: Bottom-Up Approach
Figure 6 Market Size Estimation Methodology: Top-Down Approach
Figure 7 Data Triangulation
Figure 8 Retrofit Type Expected to Hold the Largest Size for the Market During the Forecast Period
Figure 9 Component Expected to Hold the Largest Size of the Market During the Forecast Period
Figure 10 Highways and Roadways Application Expected to Dominate the Market During the Forecast Period
Figure 11 Smart Pole Market Share, By Geography
Figure 12 Attractive Growth Opportunities in the Market Between 2017 and 2023
Figure 13 Retrofit Installation Expected to Play A Significant Role in the Market
Figure 14 Highways and Roadways Application Expected to Hold the Largest Share of the Market During the Forecast Period
Figure 15 Component Expected to Dominate the Market During the Forecast Period
Figure 16 India Expected to Grow at the Highest CAGR During the Forecast Period
Figure 17 Need for Energy-Efficient Pole Lighting Systems to Drive the Market
Figure 18 Value Chain Analysis (2017) of the Market: Major Value is Added By Component Manufacturing and System Integration
Figure 19 Growing Connectivity and Closed Protocols are the Leading Trends Among Key Market Players
Figure 20 Smart Pole Segmentation, By Offering
Figure 21 Market for Components Expected to Hold the Largest Size During the Forecast Period
Figure 22 Light-Emitting Diodes Expected to Hold the Largest Market in Lighting Lamp During the Forecast Period
Figure 23 Smart Pole Segmentation, By Installation Type
Figure 24 Retrofit Installation to Hold A Larger Market Size During the Forecast Period
Figure 25 North America to Lead the Market for Retrofit Installations of Smart Poles
Figure 26 Market Segmentation, By Application
Figure 27 Highways and Roadways to Dominate the Market for Smart Poles During the Forecast Period
Figure 28 North America to Dominate the Market for the Railways and Harbors Application During the Forecast Period
Figure 29 Market Segmentation, By Region
Figure 30 Geographic Snapshot for Smart Pole Market (2016)
Figure 31 North America to Lead the Market for Smart Pole During the Forecast Period
Figure 32 North America: Market Snapshot
Figure 33 Retrofit Type Installation to Hold the Larger Market Size in US During the Forecast Period
Figure 34 Highways and Roadways Application to Lead the Market in Mexico During the Forecast Period
Figure 35 Europe: Market Snapshot
Figure 36 Highways and Roadways to Lead the Market in Germany During the Forecast Period
Figure 37 Highways and Roadways Application to Lead the Market for Smart Pole in Spain During the Forecast Period
Figure 38 APAC: Market Snapshot
Figure 39 Market for Highways and Roadways Application in China Expected to Lead the Market During the Forecast Period
Figure 40 Market for Highways and Roadways Application Expected to Hold the Largest Size of the Market in Australia During the Forecast Period
Figure 41 Middle East to Lead the Market in RoW During the Forecast Period
Figure 42 Highways and Roadways Application to Lead the Market in South America During the Forecast Period
Figure 43 Companies Adopted New Product Development as Key Growth Strategies Between 2014 and 2017
Figure 44 Battle for Market Share: New Product Launch/Development and Agreement, Partnership & Collaboration Was the Key Strategies Adopted By Companies Between 2013 and 2017
Figure 45 Philips Lighting Holding B.V.: Company Snapshot
Figure 46 General Electric Company: Company Snapshot
Figure 47 Hubbell Incorporated: Company Snapshot
Figure 48 Cree, Inc.: Company Snapshot
Figure 49 Eaton Corporation PLC: Company Snapshot
Figure 50 Acuity Brands, Inc.: Company Snapshot
Figure 51 Zumtobel Group AG: Company Snapshot


Growth opportunities and latent adjacency in Smart Pole Market