 Email
Email Print
Print


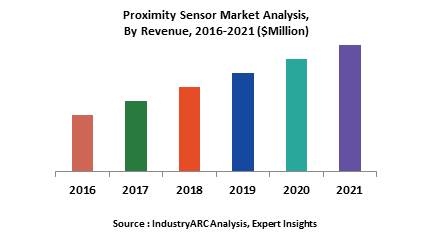
As the name suggests, a proximity sensor is used to detect the presence of objects at a certain distance without the need for any kind of physical contact. The fact that no physical contact is required results in higher durability of these kinds of sensors. Technology advances have aided in miniaturization and proximity sensors can now be integrated into small chips and be used for a plethora of applications. Main customers for proximity sensors are original equipment manufacturers (OEMs). The automotive segment represents the most lucrative market for proximity sensors. The development of self-driving cars, for example, will result in a huge boost for proximity sensors owing to the need to be able to detect the proximity of objects in relation to the vehicle.
The Proximity Sensor Market can be segmented as
The Proximity Sensor Market can be segmented as
- on the basis of type
- Capacitive, Inductive, Ultrasonic, Magnetic, LVDT, Photoelectric and Others
- In terms of products
- Parking Sensors, Assembly Lines, Roller Coasters, Anti-Aircraft Warfare, Conveyor Systems, Vibration Monitoring, Mobile Devices and Others
The automotive industry accounts for the largest share of the proximity sensor market and is expected to do so till the end of the forecast period considered in this report. Increasing adoption of factory and industrial automation is also driving the growth of this market.
- In terms of applications
- Automotive, Aerospace and Defense, Pharmaceutical, Industrial, Building Automation, Food and Beverage, Consumer Electronics and Others
North America accounted for the largest share of this market owing to the slowly recovering automotive industry in the region. APAC is expected to exhibit the highest growth rate till the end of the forecast period.
- By Geography
- North America, South America, APAC, Europe, Middle East and Africa
The proximity sensor market is highly competitive with a number of players present. Technological advancements stemming from intensive R&D efforts by the major players in this market are bringing down prices as well. However, since OEMs prefer to stick to their regular brands of proximity sensors, it is difficult for new entrants to penetrate this market.
Sample Companies profiled in this Report are:
- Pepperl+Fuchs GmbH
- Honeywell International Inc.,
- Omron Corporation
- Schneider Electric
- Rockwell Automation, Inc.,
- 10+.
1. Proximity Sensor Market –Overview
2. Executive Summary
3. Proximity Sensor Market– Landscape
3.1. Market Share Analysis
3.2. Comparative Analysis
3.2.1. Product Benchmarking
3.2.2. End User Profiling
3.2.3. Top 5 Financials Analysis
4. Proximity Sensor Market– Forces
4.1. Market Drivers
4.2. Market Constraints
4.3. Market Challenges
4.4. Attractiveness of the Proximity Sensor Market
4.4.1. Power of Suppliers
4.4.2. Power of Customers
4.4.3. Threat of New Entrants
4.4.4. Threat of Substitution
4.4.5. Degree of Competition
5. Proximity Sensor Market– Strategic Analysis
5.1. Value Chain Analysis
5.2. Pricing Analysis
5.3. Opportunities Analysis
5.4. Product/Market Life Cycle Analysis
5.5. Suppliers and Distributors
6. Proximity Sensor Market– By Type:
6.1. Capacitive
6.2. Inductive
6.3. Magnetic
6.4. Photoelectric
6.5. Ultrasonic
6.6. LVDT
6.7. Others
7. Proximity Sensor Market- By Product
7.1. Parking Sensor
7.2. Conveyor Systems
7.3. Roller Coasters
7.4. Vibration Monitoring
7.5. Mobile Devices
7.6. Assembly Lines
7.7. Anti-Aircraft Warfare
7.8. Others
8. Proximity Sensor Market– By Application:
8.1. Automotive
8.2. Aerospace and Defense
8.3. Consumer Electronics
8.4. Food and Beverage
8.5. Pharmaceutical
8.6. Industrial
8.7. Building Automation
8.8. Others
9. Proximity Sensor Market– By Geography:
9.1. Introduction
9.2. Global Study
9.3. Americas
9.3.1. North America
9.3.2. Brazil
9.3.3. Argentina
9.3.4. Others
9.4. Europe
9.4.1. U.K.
9.4.2. France
9.4.3. Germany
9.4.4. Others
9.5. APAC
9.5.1. China
9.5.2. Japan
9.5.3. India
9.5.4. Others
9.6. ROW
10. Market Entropy
10.1. New Product Launches
10.2. M&As, Collaborations, JVs and Partnerships
11. Company Profiles
11.1. Honeywell International Inc.
11.2. Fargo Controls Inc.
11.3. Avago Technologies Inc.
11.4. Omron Corporation
11.5. Sick AG
11.6. Panasonic Corporation
11.7. Rockwell Automation Inc.
11.8. Schneider Electric
11.9. GE
11.10. Sharp Corporation
11.11. Pepperl+Fuchs GmbH
11.12. Others
*More than 10 Companies are profiled in this Research Report*
"*Financials would be provided on a best efforts basis for private companies"
12. Appendix
12.1. Abbreviations
12.2. Sources
12.3. Research Methodology
12.4. Bibliography
12.5. Compilation of Expert Insights
12.6. Disclaimer
List of Tables:
Table 1: Proximity Sensor Market Overview 2021-2026
Table 2: Proximity Sensor Market Leader Analysis 2018-2019 (US$)
Table 3: Proximity Sensor Market Product Analysis 2018-2019 (US$)
Table 4: Proximity Sensor Market End User Analysis 2018-2019 (US$)
Table 5: Proximity Sensor Market Patent Analysis 2013-2018* (US$)
Table 6: Proximity Sensor Market Financial Analysis 2018-2019 (US$)
Table 7: Proximity Sensor Market Driver Analysis 2018-2019 (US$)
Table 8: Proximity Sensor Market Challenges Analysis 2018-2019 (US$)
Table 9: Proximity Sensor Market Constraint Analysis 2018-2019 (US$)
Table 10: Proximity Sensor Market Supplier Bargaining Power Analysis 2018-2019 (US$)
Table 11: Proximity Sensor Market Buyer Bargaining Power Analysis 2018-2019 (US$)
Table 12: Proximity Sensor Market Threat of Substitutes Analysis 2018-2019 (US$)
Table 13: Proximity Sensor Market Threat of New Entrants Analysis 2018-2019 (US$)
Table 14: Proximity Sensor Market Degree of Competition Analysis 2018-2019 (US$)
Table 15: Proximity Sensor Market Value Chain Analysis 2018-2019 (US$)
Table 16: Proximity Sensor Market Pricing Analysis 2021-2026 (US$)
Table 17: Proximity Sensor Market Opportunities Analysis 2021-2026 (US$)
Table 18: Proximity Sensor Market Product Life Cycle Analysis 2021-2026 (US$)
Table 19: Proximity Sensor Market Supplier Analysis 2018-2019 (US$)
Table 20: Proximity Sensor Market Distributor Analysis 2018-2019 (US$)
Table 21: Proximity Sensor Market Trend Analysis 2018-2019 (US$)
Table 22: Proximity Sensor Market Size 2018 (US$)
Table 23: Proximity Sensor Market Forecast Analysis 2021-2026 (US$)
Table 24: Proximity Sensor Market Sales Forecast Analysis 2021-2026 (Units)
Table 25: Proximity Sensor Market, Revenue & Volume,By Type, 2021-2026 ($)
Table 26: Proximity Sensor MarketBy Type, Revenue & Volume,By Capacitive, 2021-2026 ($)
Table 27: Proximity Sensor MarketBy Type, Revenue & Volume,By Inductive, 2021-2026 ($)
Table 28: Proximity Sensor MarketBy Type, Revenue & Volume,By Magnetic, 2021-2026 ($)
Table 29: Proximity Sensor MarketBy Type, Revenue & Volume,By Photoelectric, 2021-2026 ($)
Table 30: Proximity Sensor MarketBy Type, Revenue & Volume,By Ultrasonic, 2021-2026 ($)
Table 31: Proximity Sensor Market, Revenue & Volume,By Product, 2021-2026 ($)
Table 32: Proximity Sensor MarketBy Product, Revenue & Volume,By Parking Sensor, 2021-2026 ($)
Table 33: Proximity Sensor MarketBy Product, Revenue & Volume,By Conveyor Systems, 2021-2026 ($)
Table 34: Proximity Sensor MarketBy Product, Revenue & Volume,By Roller Coasters, 2021-2026 ($)
Table 35: Proximity Sensor MarketBy Product, Revenue & Volume,By Vibration Monitoring, 2021-2026 ($)
Table 36: Proximity Sensor MarketBy Product, Revenue & Volume,By Mobile Devices, 2021-2026 ($)
Table 37: Proximity Sensor Market, Revenue & Volume,By Application, 2021-2026 ($)
Table 38: Proximity Sensor MarketBy Application, Revenue & Volume,By Automotive1, 2021-2026 ($)
Table 39: Proximity Sensor MarketBy Application, Revenue & Volume,By Aerospace and Defense, 2021-2026 ($)
Table 40: Proximity Sensor MarketBy Application, Revenue & Volume,By Consumer Electronics, 2021-2026 ($)
Table 41: Proximity Sensor MarketBy Application, Revenue & Volume,By Food and Beverage, 2021-2026 ($)
Table 42: Proximity Sensor MarketBy Application, Revenue & Volume,By Pharmaceutical, 2021-2026 ($)
Table 43: North America Proximity Sensor Market, Revenue & Volume,By Type, 2021-2026 ($)
Table 44: North America Proximity Sensor Market, Revenue & Volume,By Product, 2021-2026 ($)
Table 45: North America Proximity Sensor Market, Revenue & Volume,By Application, 2021-2026 ($)
Table 46: South america Proximity Sensor Market, Revenue & Volume,By Type, 2021-2026 ($)
Table 47: South america Proximity Sensor Market, Revenue & Volume,By Product, 2021-2026 ($)
Table 48: South america Proximity Sensor Market, Revenue & Volume,By Application, 2021-2026 ($)
Table 49: Europe Proximity Sensor Market, Revenue & Volume,By Type, 2021-2026 ($)
Table 50: Europe Proximity Sensor Market, Revenue & Volume,By Product, 2021-2026 ($)
Table 51: Europe Proximity Sensor Market, Revenue & Volume,By Application, 2021-2026 ($)
Table 52: APAC Proximity Sensor Market, Revenue & Volume,By Type, 2021-2026 ($)
Table 53: APAC Proximity Sensor Market, Revenue & Volume,By Product, 2021-2026 ($)
Table 54: APAC Proximity Sensor Market, Revenue & Volume,By Application, 2021-2026 ($)
Table 55: Middle East & Africa Proximity Sensor Market, Revenue & Volume,By Type, 2021-2026 ($)
Table 56: Middle East & Africa Proximity Sensor Market, Revenue & Volume,By Product, 2021-2026 ($)
Table 57: Middle East & Africa Proximity Sensor Market, Revenue & Volume,By Application, 2021-2026 ($)
Table 58: Russia Proximity Sensor Market, Revenue & Volume,By Type, 2021-2026 ($)
Table 59: Russia Proximity Sensor Market, Revenue & Volume,By Product, 2021-2026 ($)
Table 60: Russia Proximity Sensor Market, Revenue & Volume,By Application, 2021-2026 ($)
Table 61: Israel Proximity Sensor Market, Revenue & Volume,By Type, 2021-2026 ($)
Table 62: Israel Proximity Sensor Market, Revenue & Volume,By Product, 2021-2026 ($)
Table 63: Israel Proximity Sensor Market, Revenue & Volume,By Application, 2021-2026 ($)
Table 64: Top Companies 2018 (US$)Proximity Sensor Market, Revenue & Volume
Table 65: Product Launch 2018-2019Proximity Sensor Market, Revenue & Volume
Table 66: Mergers & Acquistions 2018-2019Proximity Sensor Market, Revenue & Volume
List of Figures:
Figure 1: Overview of Proximity Sensor Market 2021-2026
Figure 2: Market Share Analysis for Proximity Sensor Market 2018 (US$)
Figure 3: Product Comparison in Proximity Sensor Market 2018-2019 (US$)
Figure 4: End User Profile for Proximity Sensor Market 2018-2019 (US$)
Figure 5: Patent Application and Grant in Proximity Sensor Market 2013-2018* (US$)
Figure 6: Top 5 Companies Financial Analysis in Proximity Sensor Market 2018-2019 (US$)
Figure 7: Market Entry Strategy in Proximity Sensor Market 2018-2019
Figure 8: Ecosystem Analysis in Proximity Sensor Market2018
Figure 9: Average Selling Price in Proximity Sensor Market 2021-2026
Figure 10: Top Opportunites in Proximity Sensor Market 2018-2019
Figure 11: Market Life Cycle Analysis in Proximity Sensor Market
Figure 12: GlobalBy TypeProximity Sensor Market Revenue, 2021-2026 ($)
Figure 13: GlobalBy ProductProximity Sensor Market Revenue, 2021-2026 ($)
Figure 14: GlobalBy ApplicationProximity Sensor Market Revenue, 2021-2026 ($)
Figure 15: Global Proximity Sensor Market - By Geography
Figure 16: Global Proximity Sensor Market Value & Volume, By Geography, 2021-2026 ($)
Figure 17: Global Proximity Sensor Market CAGR, By Geography, 2021-2026 (%)
Figure 18: North America Proximity Sensor Market Value & Volume, 2021-2026 ($)
Figure 19: US Proximity Sensor Market Value & Volume, 2021-2026 ($)
Figure 20: US GDP and Population, 2018-2019 ($)
Figure 21: US GDP – Composition of 2018, By Sector of Origin
Figure 22: US Export and Import Value & Volume, 2018-2019 ($)
Figure 23: Canada Proximity Sensor Market Value & Volume, 2021-2026 ($)
Figure 24: Canada GDP and Population, 2018-2019 ($)
Figure 25: Canada GDP – Composition of 2018, By Sector of Origin
Figure 26: Canada Export and Import Value & Volume, 2018-2019 ($)
Figure 27: Mexico Proximity Sensor Market Value & Volume, 2021-2026 ($)
Figure 28: Mexico GDP and Population, 2018-2019 ($)
Figure 29: Mexico GDP – Composition of 2018, By Sector of Origin
Figure 30: Mexico Export and Import Value & Volume, 2018-2019 ($)
Figure 31: South America Proximity Sensor MarketSouth America 3D Printing Market Value & Volume, 2021-2026 ($)
Figure 32: Brazil Proximity Sensor Market Value & Volume, 2021-2026 ($)
Figure 33: Brazil GDP and Population, 2018-2019 ($)
Figure 34: Brazil GDP – Composition of 2018, By Sector of Origin
Figure 35: Brazil Export and Import Value & Volume, 2018-2019 ($)
Figure 36: Venezuela Proximity Sensor Market Value & Volume, 2021-2026 ($)
Figure 37: Venezuela GDP and Population, 2018-2019 ($)
Figure 38: Venezuela GDP – Composition of 2018, By Sector of Origin
Figure 39: Venezuela Export and Import Value & Volume, 2018-2019 ($)
Figure 40: Argentina Proximity Sensor Market Value & Volume, 2021-2026 ($)
Figure 41: Argentina GDP and Population, 2018-2019 ($)
Figure 42: Argentina GDP – Composition of 2018, By Sector of Origin
Figure 43: Argentina Export and Import Value & Volume, 2018-2019 ($)
Figure 44: Ecuador Proximity Sensor Market Value & Volume, 2021-2026 ($)
Figure 45: Ecuador GDP and Population, 2018-2019 ($)
Figure 46: Ecuador GDP – Composition of 2018, By Sector of Origin
Figure 47: Ecuador Export and Import Value & Volume, 2018-2019 ($)
Figure 48: Peru Proximity Sensor Market Value & Volume, 2021-2026 ($)
Figure 49: Peru GDP and Population, 2018-2019 ($)
Figure 50: Peru GDP – Composition of 2018, By Sector of Origin
Figure 51: Peru Export and Import Value & Volume, 2018-2019 ($)
Figure 52: Colombia Proximity Sensor Market Value & Volume, 2021-2026 ($)
Figure 53: Colombia GDP and Population, 2018-2019 ($)
Figure 54: Colombia GDP – Composition of 2018, By Sector of Origin
Figure 55: Colombia Export and Import Value & Volume, 2018-2019 ($)
Figure 56: Costa Rica Proximity Sensor MarketCosta Rica 3D Printing Market Value & Volume, 2021-2026 ($)
Figure 57: Costa Rica GDP and Population, 2018-2019 ($)
Figure 58: Costa Rica GDP – Composition of 2018, By Sector of Origin
Figure 59: Costa Rica Export and Import Value & Volume, 2018-2019 ($)
Figure 60: Europe Proximity Sensor Market Value & Volume, 2021-2026 ($)
Figure 61: U.K Proximity Sensor Market Value & Volume, 2021-2026 ($)
Figure 62: U.K GDP and Population, 2018-2019 ($)
Figure 63: U.K GDP – Composition of 2018, By Sector of Origin
Figure 64: U.K Export and Import Value & Volume, 2018-2019 ($)
Figure 65: Germany Proximity Sensor Market Value & Volume, 2021-2026 ($)
Figure 66: Germany GDP and Population, 2018-2019 ($)
Figure 67: Germany GDP – Composition of 2018, By Sector of Origin
Figure 68: Germany Export and Import Value & Volume, 2018-2019 ($)
Figure 69: Italy Proximity Sensor Market Value & Volume, 2021-2026 ($)
Figure 70: Italy GDP and Population, 2018-2019 ($)
Figure 71: Italy GDP – Composition of 2018, By Sector of Origin
Figure 72: Italy Export and Import Value & Volume, 2018-2019 ($)
Figure 73: France Proximity Sensor Market Value & Volume, 2021-2026 ($)
Figure 74: France GDP and Population, 2018-2019 ($)
Figure 75: France GDP – Composition of 2018, By Sector of Origin
Figure 76: France Export and Import Value & Volume, 2018-2019 ($)
Figure 77: Netherlands Proximity Sensor Market Value & Volume, 2021-2026 ($)
Figure 78: Netherlands GDP and Population, 2018-2019 ($)
Figure 79: Netherlands GDP – Composition of 2018, By Sector of Origin
Figure 80: Netherlands Export and Import Value & Volume, 2018-2019 ($)
Figure 81: Belgium Proximity Sensor Market Value & Volume, 2021-2026 ($)
Figure 82: Belgium GDP and Population, 2018-2019 ($)
Figure 83: Belgium GDP – Composition of 2018, By Sector of Origin
Figure 84: Belgium Export and Import Value & Volume, 2018-2019 ($)
Figure 85: Spain Proximity Sensor Market Value & Volume, 2021-2026 ($)
Figure 86: Spain GDP and Population, 2018-2019 ($)
Figure 87: Spain GDP – Composition of 2018, By Sector of Origin
Figure 88: Spain Export and Import Value & Volume, 2018-2019 ($)
Figure 89: Denmark Proximity Sensor Market Value & Volume, 2021-2026 ($)
Figure 90: Denmark GDP and Population, 2018-2019 ($)
Figure 91: Denmark GDP – Composition of 2018, By Sector of Origin
Figure 92: Denmark Export and Import Value & Volume, 2018-2019 ($)
Figure 93: APAC Proximity Sensor Market Value & Volume, 2021-2026 ($)
Figure 94: China Proximity Sensor MarketValue & Volume, 2021-2026
Figure 95: China GDP and Population, 2018-2019 ($)
Figure 96: China GDP – Composition of 2018, By Sector of Origin
Figure 97: China Export and Import Value & Volume, 2018-2019 ($)Proximity Sensor MarketChina Export and Import Value & Volume, 2018-2019 ($)
Figure 98: Australia Proximity Sensor Market Value & Volume, 2021-2026 ($)
Figure 99: Australia GDP and Population, 2018-2019 ($)
Figure 100: Australia GDP – Composition of 2018, By Sector of Origin
Figure 101: Australia Export and Import Value & Volume, 2018-2019 ($)
Figure 102: South Korea Proximity Sensor Market Value & Volume, 2021-2026 ($)
Figure 103: South Korea GDP and Population, 2018-2019 ($)
Figure 104: South Korea GDP – Composition of 2018, By Sector of Origin
Figure 105: South Korea Export and Import Value & Volume, 2018-2019 ($)
Figure 106: India Proximity Sensor Market Value & Volume, 2021-2026 ($)
Figure 107: India GDP and Population, 2018-2019 ($)
Figure 108: India GDP – Composition of 2018, By Sector of Origin
Figure 109: India Export and Import Value & Volume, 2018-2019 ($)
Figure 110: Taiwan Proximity Sensor MarketTaiwan 3D Printing Market Value & Volume, 2021-2026 ($)
Figure 111: Taiwan GDP and Population, 2018-2019 ($)
Figure 112: Taiwan GDP – Composition of 2018, By Sector of Origin
Figure 113: Taiwan Export and Import Value & Volume, 2018-2019 ($)
Figure 114: Malaysia Proximity Sensor MarketMalaysia 3D Printing Market Value & Volume, 2021-2026 ($)
Figure 115: Malaysia GDP and Population, 2018-2019 ($)
Figure 116: Malaysia GDP – Composition of 2018, By Sector of Origin
Figure 117: Malaysia Export and Import Value & Volume, 2018-2019 ($)
Figure 118: Hong Kong Proximity Sensor MarketHong Kong 3D Printing Market Value & Volume, 2021-2026 ($)
Figure 119: Hong Kong GDP and Population, 2018-2019 ($)
Figure 120: Hong Kong GDP – Composition of 2018, By Sector of Origin
Figure 121: Hong Kong Export and Import Value & Volume, 2018-2019 ($)
Figure 122: Middle East & Africa Proximity Sensor MarketMiddle East & Africa 3D Printing Market Value & Volume, 2021-2026 ($)
Figure 123: Russia Proximity Sensor MarketRussia 3D Printing Market Value & Volume, 2021-2026 ($)
Figure 124: Russia GDP and Population, 2018-2019 ($)
Figure 125: Russia GDP – Composition of 2018, By Sector of Origin
Figure 126: Russia Export and Import Value & Volume, 2018-2019 ($)
Figure 127: Israel Proximity Sensor Market Value & Volume, 2021-2026 ($)
Figure 128: Israel GDP and Population, 2018-2019 ($)
Figure 129: Israel GDP – Composition of 2018, By Sector of Origin
Figure 130: Israel Export and Import Value & Volume, 2018-2019 ($)
Figure 131: Entropy Share, By Strategies, 2018-2019* (%)Proximity Sensor Market
Figure 132: Developments, 2018-2019*Proximity Sensor Market
Figure 133: Company 1 Proximity Sensor Market Net Revenue, By Years, 2018-2019* ($)
Figure 134: Company 1 Proximity Sensor Market Net Revenue Share, By Business segments, 2018 (%)
Figure 135: Company 1 Proximity Sensor Market Net Sales Share, By Geography, 2018 (%)
Figure 136: Company 2 Proximity Sensor Market Net Revenue, By Years, 2018-2019* ($)
Figure 137: Company 2 Proximity Sensor Market Net Revenue Share, By Business segments, 2018 (%)
Figure 138: Company 2 Proximity Sensor Market Net Sales Share, By Geography, 2018 (%)
Figure 139: Company 3Proximity Sensor Market Net Revenue, By Years, 2018-2019* ($)
Figure 140: Company 3Proximity Sensor Market Net Revenue Share, By Business segments, 2018 (%)
Figure 141: Company 3Proximity Sensor Market Net Sales Share, By Geography, 2018 (%)
Figure 142: Company 4 Proximity Sensor Market Net Revenue, By Years, 2018-2019* ($)
Figure 143: Company 4 Proximity Sensor Market Net Revenue Share, By Business segments, 2018 (%)
Figure 144: Company 4 Proximity Sensor Market Net Sales Share, By Geography, 2018 (%)
Figure 145: Company 5 Proximity Sensor Market Net Revenue, By Years, 2018-2019* ($)
Figure 146: Company 5 Proximity Sensor Market Net Revenue Share, By Business segments, 2018 (%)
Figure 147: Company 5 Proximity Sensor Market Net Sales Share, By Geography, 2018 (%)
Figure 148: Company 6 Proximity Sensor Market Net Revenue, By Years, 2018-2019* ($)
Figure 149: Company 6 Proximity Sensor Market Net Revenue Share, By Business segments, 2018 (%)
Figure 150: Company 6 Proximity Sensor Market Net Sales Share, By Geography, 2018 (%)
Figure 151: Company 7 Proximity Sensor Market Net Revenue, By Years, 2018-2019* ($)
Figure 152: Company 7 Proximity Sensor Market Net Revenue Share, By Business segments, 2018 (%)
Figure 153: Company 7 Proximity Sensor Market Net Sales Share, By Geography, 2018 (%)
Figure 154: Company 8 Proximity Sensor Market Net Revenue, By Years, 2018-2019* ($)
Figure 155: Company 8 Proximity Sensor Market Net Revenue Share, By Business segments, 2018 (%)
Figure 156: Company 8 Proximity Sensor Market Net Sales Share, By Geography, 2018 (%)
Figure 157: Company 9 Proximity Sensor Market Net Revenue, By Years, 2018-2019* ($)
Figure 158: Company 9 Proximity Sensor Market Net Revenue Share, By Business segments, 2018 (%)
Figure 159: Company 9 Proximity Sensor Market Net Sales Share, By Geography, 2018 (%)
Figure 160: Company 10 Proximity Sensor Market Net Revenue, By Years, 2018-2019* ($)
Figure 161: Company 10 Proximity Sensor Market Net Revenue Share, By Business segments, 2018 (%)
Figure 162: Company 10 Proximity Sensor Market Net Sales Share, By Geography, 2018 (%)
Figure 163: Company 11 Proximity Sensor Market Net Revenue, By Years, 2018-2019* ($)
Figure 164: Company 11 Proximity Sensor Market Net Revenue Share, By Business segments, 2018 (%)
Figure 165: Company 11 Proximity Sensor Market Net Sales Share, By Geography, 2018 (%)
Figure 166: Company 12 Proximity Sensor Market Net Revenue, By Years, 2018-2019* ($)
Figure 167: Company 12 Proximity Sensor Market Net Revenue Share, By Business segments, 2018 (%)
Figure 168: Company 12 Proximity Sensor Market Net Sales Share, By Geography, 2018 (%)
Figure 169: Company 13Proximity Sensor Market Net Revenue, By Years, 2018-2019* ($)
Figure 170: Company 13Proximity Sensor Market Net Revenue Share, By Business segments, 2018 (%)
Figure 171: Company 13Proximity Sensor Market Net Sales Share, By Geography, 2018 (%)
Figure 172: Company 14 Proximity Sensor Market Net Revenue, By Years, 2018-2019* ($)
Figure 173: Company 14 Proximity Sensor Market Net Revenue Share, By Business segments, 2018 (%)
Figure 174: Company 14 Proximity Sensor Market Net Sales Share, By Geography, 2018 (%)
Figure 175: Company 15 Proximity Sensor Market Net Revenue, By Years, 2018-2019* ($)
Figure 176: Company 15 Proximity Sensor Market Net Revenue Share, By Business segments, 2018 (%)
Figure 177: Company 15 Proximity Sensor Market Net Sales Share, By Geography, 2018 (%)