
Analysts’ Viewpoint on Market Scenario
Adoption of new technology and improved infrastructure are expected to provide a much-needed boost to the rail transportation industry and consequently, augment autonomous trains market progress. Railroad firms must make modifications to their current operations in order to sustain profitability and successfully meet the demand for rail transportation. They also need to upgrade in order to cater to the rise in rail passenger and freight traffic as well as the ongoing expansion of the rail network.
The introduction of autonomous rail technology is anticipated to successfully solve several issues such as rising demand, safety concerns, extra expenses, environmental difficulties, human errors, and increased traffic congestion. Better accessibility, more mobility, and improved land use are a few of the key advantages of integration of autonomous rail technology in transportation. Electric trains and AV technology used in tandem are likely to greatly reduce pollution and safeguard the environment.
Autonomous trains facilitate the transport of more number of people and higher volume of cargo. This is advantageous for the environment, as railroad is one of the least polluting types of transportation. The combination of autonomous operation and moving block signaling has the potential to boost rail capacity by up to 50%, enabling greater low-carbon travel without the need to construct additional rail lines.
Autonomous trains also have the ability to collect information about their surroundings, including cuts, embankments, lineside infrastructure, structures, and vegetation, such as trees. This can be used to build a topographic database and establish a baseline of normality against which deviations can be monitored in real time. This can be improved any further by incorporating outside data, such as weather reports. This is extremely useful for applications such as predicting the risk of a slip-and-fall during the leaf-fall season and monitoring of tracks.
Request a sample to get extensive insights into the Autonomous Trains Market
Increase in globalization and growing urbanization has led to greater need for transportation of goods and freight. It has also driven the demand for larger mobility solutions. A smaller more connected world has further reinforced the trend of preference for autonomous rail transport.
Consequently, a shortage of trained drivers is a foreseeable event predicted in the immediate future. This, in turn, is estimated to contribute to market demand for autonomous trains during the forecast period. Furthermore, rising tailpipe emission levels and growing trend of electrification are also likely to boost autonomous trains market development across the globe.
An increasing number of metro lines in cities all over the world have already adopted driverless train operation with Grade of Automation (GoA) Level 4. Higher levels of automation, starting with driver assistance systems and progressing to automatic obstacle detection, help mainline, regional, and tram operators to boost the capacity, flexibility, and energy efficiency of their rail operations. Automatic obstacle detection is a crucial building block in future train automation in various use cases.
Request a custom report on Autonomous Trains Market
Municipal and government authorities are rapidly expanding metro and monorail infrastructure in major cities across the globe to tackle traffic congestion in urban areas. This, in turn, is estimated to boost the market demand for autonomous trains for the efficient and smooth operation of such mass transit rail networks.
For instance, Sydney Metro, in Australia, is a driverless rapid transit system that uses fully-automated metropolis trains assisted with the Urbalis 400 communication based train control (CBTC) signaling system. In November 2021, Delhi Metro started driverless train operations (DTO) on its 59 km Pink line to become the fourth largest DTO- mass rapid transit system across the globe.
Growing penetration of driverless or autonomous technology for urban transit rail, such as metro rails, monorails, and trams, is likely to drive the application of autonomous trains for passenger transit, as compared to freight transport, in the next few years.
According to the latest autonomous trains market trends, Asia Pacific is projected to witness rapid increase in demand for autonomous trains during the forecast period. Growth of the Asia Pacific market is primarily attributed to increase in industrialization and urbanization in expanding economies such as China, India, and South Korea.
In 2021, Europe held the second-largest market share for driverless trains worldwide. Additionally, North America accounted for the third-largest market share for autonomous trains in 2021. Fully automated and semi-autonomous (GoA 3) metro lines have been constructed in North America and are already in use commercially.
Leading players in the global autonomous trains business are adopting new technologies and emphasizing on mergers and acquisitions and product portfolio expansion. Some of the prominent players operating in the global autonomous trains market include ABB, Alstom, American Equipment Company, Beijing Traffic Control Technology, Belden, Bharat Forge, Bombardier, CAF, Calamp, CRRC, Deuta, Deutsche Bahn, General Electric, Hitachi, Hollysys, Ingeteam, Intesens, Kawasaki Heavy Industries, Mitsubishi Heavy Industries, Siemens, Tech Mahindra Ltd., Thales Group, Transmashholding, Tvema, and Wabtec Corporation.
Key players profiled in the autonomous trains market report based on parameters such as company overview, financial overview, business strategies, product portfolio, business segments, and recent developments.
|
Attribute |
Detail |
|
Market Size Value in 2021 |
US$ 6.1 Bn |
|
Market Forecast Value in 2031 |
US$ 25.0 Bn |
|
Growth Rate (CAGR) |
15.2% |
|
Forecast Period |
2022–2031 |
|
Historical Data Available for |
2017–2021 |
|
Quantitative Units |
US$ Bn for Value and Units for Volume |
|
Market Analysis |
It includes cross segment analysis at Global as well as regional level. Furthermore, qualitative analysis includes drivers, restraints, opportunities, key trends, Porter’s Five Forces analysis, value chain analysis, and key trend analysis. |
|
Competition Landscape |
|
|
Format |
Electronic (PDF) + Excel |
|
Market Segmentation |
|
|
Regions Covered |
|
|
Countries Covered |
|
|
Companies Profiled |
|
|
Customization Scope |
Available upon request |
|
Pricing |
Available upon request |
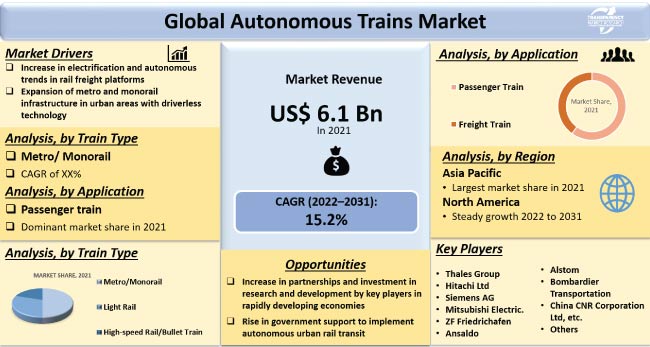
It was valued at US$ 6.1 Bn in 2021.
The market is expected to expand at a CAGR of 15.2% by 2031.
It is estimated to reach a value of US$ 25.0 Bn in 2031.
Increase in electrification and autonomous trend in rail freight platforms and low emission transport alternatives to mitigate pollution levels.
In terms of train type, the metro/monorail segment is likely to account for majority share by 2031.
Asia pacific is anticipated to be the highly lucrative region of the global market.
ABB, Alstom, American Equipment Company, Beijing Traffic Control Technology, Belden, Bharat Forge, Bombardier, CAF, Calamp, CRRC, Deuta, Deutsche Bahn, General Electric, Hitachi, Hollysys, Ingeteam, Intesens, Kawasaki Heavy Industries, Mitsubishi Heavy Industries, Siemens, Tech Mahindra Ltd., Thales Group, Transmashholding, Tvema, and Wabtec Corporation.
1. Executive Summary
1.1. Global Market Outlook
1.1.1. Market Volume (Units) & Value US$ Bn, 2017-2031
1.2. Demand & Supply Side Trends
1.3. TMR Analysis and Recommendations
1.4. Competitive Dashboard Analysis
2. Market Overview
2.1. Market Coverage / Taxonomy
2.2. Macro-Economic Factors
2.2.1. FDI and Government Investments
2.2.2. Median Individual Income
2.2.3. Urbanization and Railway Infrastructure
2.3. Forecast Factors - Relevance & Impact
2.3.1. Edge Computing trends
2.3.2. Industry Trends and Emerging Technologies
2.4. Market Dynamics
2.4.1. Drivers
2.4.2. Restraints
2.4.3. Opportunity
2.5. Market Factor Analysis
2.5.1. Porter’s Five Force Analysis
2.5.2. SWOT Analysis
2.5.3. PESTEL Analysis
2.6. Regulatory Scenario by Country/ Region
2.7. Key Trend Analysis
2.8. Technology Roadmap
2.9. Manufacturer’s Perspective
3. Industry Ecosystem Analysis
3.1. Value Chain Analysis
3.1.1. Who Supplies Whom
3.2. Vendor Matrix
3.3. Gross Margin Analysis
4. Pricing Analysis
4.1. Cost Structure Analysis
4.2. Profit Margin Analysis
5. Impact Factors
5.1. Developments in the Artificial Intelligence Technology
5.2. Smart City Cluster – Connected Transportation Services
5.3. Railway Infrastructure
5.4. Cyber security Concerns
5.5. Edge Computing Trends
5.6. Trains Data Monetization
5.7. Service Benefits for Onboard Passengers
6. COVID-19 Impact Analysis –
6.1. Global Impact & Analysis
6.2. Regional Impact & Analysis
6.3. Government Countermeasures
7. Autonomous Trains Market – An Emerging Market for Freight Trains
8. Autonomous Trains Market Key Players -
8.1. SWOT Analysis
8.2. Profitability Analysis
9. Railway Budget Allocations by Country
10. Railway Production Statistics – Global/ by Geography
11. Autonomous Trains Market, by Track Length (Kilometers)
11.1. Market Snapshot
11.1.1. Introduction and Key Findings
11.1.2. Market Growth & Y-o-Y Projections
11.2. North America
11.2.1. U.S.
11.2.2. Canada
11.2.3. Mexico
11.3. Europe
11.3.1. Germany
11.3.2. U. K.
11.3.3. France
11.3.4. Italy
11.3.5. Spain
11.3.6. Nordic Countries
11.3.7. Russia & CIS
11.3.8. Rest of Europe
11.4. Asia Pacific
11.4.1. China
11.4.2. India
11.4.3. Japan
11.4.4. ASEAN Countries
11.4.5. South Korea
11.4.6. ANZ
11.4.7. Rest of Asia Pacific
11.5. Middle East & Africa
11.5.1. GCC
11.5.2. South Africa
11.5.3. Turkey
11.5.4. Rest of Middle East & Africa
11.6. South America
11.6.1. Brazil
11.6.2. Argentina
11.6.3. Rest of South America
12. Global Autonomous Trains Market, by Grade of Automation
12.1. Market Snapshot
12.1.1. Introduction, Definition, and Key Findings
12.1.2. Market Growth & Y-o-Y Projections
12.1.3. Base Point Share Analysis
12.2. Global Autonomous Trains Market Volume (Units) & Value (US$ Bn), Analysis & Forecast, 2017-2031, By Grade of Automation
12.2.1. GOA 1
12.2.2. GOA 2
12.2.3. GOA 3
12.2.4. GOA 4
13. Global Autonomous Trains Market, by Train Type
13.1. Market Snapshot
13.1.1. Introduction, Definition, and Key Findings
13.1.2. Market Growth & Y-o-Y Projections
13.1.3. Base Point Share Analysis
13.2. Global Autonomous Trains Market Volume (Units) & Value (US$ Bn) Analysis & Forecast, 2017-2031, By Train Type
13.2.1. Metro/Monorail
13.2.2. Light Rail
13.2.3. High-speed Rail/Bullet Train
14. Global Autonomous Trains Market, by Technology
14.1. Market Snapshot
14.1.1. Introduction, Definition, and Key Findings
14.1.2. Market Growth & Y-o-Y Projections
14.1.3. Base Point Share Analysis
14.2. Global Autonomous Trains Market Volume (Units) & Value (US$ Bn) Analysis & Forecast, 2017-2031, By Technology
14.2.1. CBTC
14.2.2. ERTMS
14.2.3. PTC
14.2.4. ATC
15. Global Autonomous Trains Market, by Component
15.1. Market Snapshot
15.1.1. Introduction, Definition, and Key Findings
15.1.2. Market Growth & Y-o-Y Projections
15.1.3. Base Point Share Analysis
15.2. Global Autonomous Trains Market Volume (Units) & Value (US$ Bn) Analysis & Forecast, 2017-2031, By Component
15.2.1. Tachometer
15.2.2. Doppler
15.2.3. Accelerometer
15.2.4. Camera
15.2.5. Antenna
15.2.6. Radio Set
16. Global Autonomous Trains Market, by Application
16.1. Market Snapshot
16.1.1. Introduction, Definition, and Key Findings
16.1.2. Market Growth & Y-o-Y Projections
16.1.3. Base Point Share Analysis
16.2. Global Autonomous Trains Market Volume (Units) & Value (US$ Bn) Analysis & Forecast, 2017-2031, By Application
16.2.1. Passenger Train
16.2.2. Freight Train
17. Global Autonomous Trains Market, by Track Length
17.1. Market Snapshot
17.1.1. Introduction, Definition, and Key Findings
17.1.2. Market Growth & Y-o-Y Projections
17.1.3. Base Point Share Analysis
18. Global Autonomous Trains Market, by Region
18.1. Market Snapshot
18.1.1. Introduction, Definition, and Key Findings
18.1.2. Market Growth & Y-o-Y Projections
18.1.3. Base Point Share Analysis
18.2. Global Autonomous Trains Market Volume (Units) & Value (US$ Bn) Analysis & Forecast, 2017-2031, By Region
18.2.1. North America
18.2.2. Europe
18.2.3. Asia Pacific
18.2.4. Middle East & Africa
18.2.5. South America
19. North America Autonomous Trains Market
19.1. Market Snapshot
19.2. Autonomous Trains Market Volume (Units) & Value (US$ Bn) Analysis & Forecast, 2017-2031, By Grade of Automation
19.2.1. GOA 1
19.2.2. GOA 2
19.2.3. GOA 3
19.2.4. GOA 4
19.3. Autonomous Trains Market Volume (Units) & Value (US$ Bn) Analysis & Forecast, 2017-2031, By Train Type
19.3.1. Metro/Monorail
19.3.2. Light Rail
19.3.3. High-speed Rail/Bullet Train
19.4. Autonomous Trains Market Volume (Units) & Value (US$ Bn) Analysis & Forecast, 2017-2031, By Technology
19.4.1. CBTC
19.4.2. ERTMS
19.4.3. PTC
19.4.4. ATC
19.5. Autonomous Trains Market Volume (Units) & Value (US$ Bn) Analysis & Forecast, 2017-2031, By Component
19.5.1. Tachometer
19.5.2. Doppler
19.5.3. Accelerometer
19.5.4. Camera
19.5.5. Antenna
19.5.6. Radio Set
19.6. Autonomous Trains Market Volume (Units) & Value (US$ Bn) Analysis & Forecast, 2017-2031, By Application
19.6.1. Passenger Train
19.6.2. Freight Train
19.7. Key Country Analysis – North America Autonomous Trains Market Volume (Units) & Value (US$ Bn) Analysis & Forecast, 2017-2031
19.7.1. U.S.
19.7.2. Canada
19.7.3. Mexico
20. Europe Autonomous Trains Market
20.1. Market Snapshot
20.2. Autonomous Trains Market Volume (Units) & Value (US$ Bn) Analysis & Forecast, 2017-2031, By Grade of Automation
20.2.1. GOA 1
20.2.2. GOA 2
20.2.3. GOA 3
20.2.4. GOA 4
20.3. Autonomous Trains Market Volume (Units) & Value (US$ Bn) Analysis & Forecast, 2017-2031, By Train Type
20.3.1. Metro/Monorail
20.3.2. Light Rail
20.3.3. High-speed Rail/Bullet Train
20.4. Autonomous Trains Market Volume (Units) & Value (US$ Bn) Analysis & Forecast, 2017-2031, By Technology
20.4.1. CBTC
20.4.2. ERTMS
20.4.3. PTC
20.4.4. ATC
20.5. Autonomous Trains Market Volume (Units) & Value (US$ Bn) Analysis & Forecast, 2017-2031, By Component
20.5.1. Tachometer
20.5.2. Doppler
20.5.3. Accelerometer
20.5.4. Camera
20.5.5. Antenna
20.5.6. Radio Set
20.6. Autonomous Trains Market Volume (Units) & Value (US$ Bn) Analysis & Forecast, 2017-2031, By Application
20.6.1. Passenger Train
20.6.2. Freight Train
20.7. Key Country Analysis – Europe Autonomous Trains Market Volume (Units) & Value (US$ Bn) Analysis & Forecast, 2017-2031
20.7.1. Germany
20.7.2. U. K.
20.7.3. France
20.7.4. Italy
20.7.5. Spain
20.7.6. Nordic Countries
20.7.7. Russia & CIS
20.7.8. Rest of Europe
21. Asia Pacific Autonomous Trains Market
21.1. Market Snapshot
21.2. Autonomous Trains Market Volume (Units) & Value (US$ Bn) Analysis & Forecast, 2017-2031, By Grade of Automation
21.2.1. GOA 1
21.2.2. GOA 2
21.2.3. GOA 3
21.2.4. GOA 4
21.3. Autonomous Trains Market Volume (Units) & Value (US$ Bn) Analysis & Forecast, 2017-2031, By Train Type
21.3.1. Metro/Monorail
21.3.2. Light Rail
21.3.3. High-speed Rail/Bullet Train
21.4. Autonomous Trains Market Volume (Units) & Value (US$ Bn) Analysis & Forecast, 2017-2031, By Technology
21.4.1. CBTC
21.4.2. ERTMS
21.4.3. PTC
21.4.4. ATC
21.5. Autonomous Trains Market Volume (Units) & Value (US$ Bn) Analysis & Forecast, 2017-2031, By Component
21.5.1. Tachometer
21.5.2. Doppler
21.5.3. Accelerometer
21.5.4. Camera
21.5.5. Antenna
21.5.6. Radio Set
21.6. Autonomous Trains Market Volume (Units) & Value (US$ Bn) Analysis & Forecast, 2017-2031, By Application
21.6.1. Passenger Train
21.6.2. Freight Train
21.7. Key Country Analysis – Asia Pacific Autonomous Trains Market Volume (Units) & Value (US$ Bn) Analysis & Forecast, 2017-2031
21.7.1. China
21.7.2. India
21.7.3. Japan
21.7.4. ASEAN Countries
21.7.5. South Korea
21.7.6. ANZ
21.7.7. Rest of Asia Pacific
22. Middle East & Africa Autonomous Trains Market
22.1. Market Snapshot
22.2. Autonomous Trains Market Volume (Units) & Value (US$ Bn) Analysis & Forecast, 2017-2031, By Grade of Automation
22.2.1. GOA 1
22.2.2. GOA 2
22.2.3. GOA 3
22.2.4. GOA 4
22.3. Autonomous Trains Market Volume (Units) & Value (US$ Bn) Analysis & Forecast, 2017-2031, By Train Type
22.3.1. Metro/Monorail
22.3.2. Light Rail
22.3.3. High-speed Rail/Bullet Train
22.4. Autonomous Trains Market Volume (Units) & Value (US$ Bn) Analysis & Forecast, 2017-2031, By Technology
22.4.1. CBTC
22.4.2. ERTMS
22.4.3. PTC
22.4.4. ATC
22.5. Autonomous Trains Market Volume (Units) & Value (US$ Bn) Analysis & Forecast, 2017-2031, By Component
22.5.1. Tachometer
22.5.2. Doppler
22.5.3. Accelerometer
22.5.4. Camera
22.5.5. Antenna
22.5.6. Radio Set
22.6. Autonomous Trains Market Volume (Units) & Value (US$ Bn) Analysis & Forecast, 2017-2031, By Application
22.6.1. Passenger Train
22.6.2. Freight Train
22.7. Key Country Analysis – Middle East & Africa Autonomous Trains Market Volume (Units) & Value (US$ Bn) Analysis & Forecast, 2017-2031
22.7.1. GCC
22.7.2. South Africa
22.7.3. Turkey
22.7.4. Rest of Middle East & Africa
23. South America Autonomous Trains Market
23.1. Market Snapshot
23.2. Autonomous Trains Market Volume (Units) & Value (US$ Bn) Analysis & Forecast, 2017-2031, By Grade of Automation
23.2.1. GOA 1
23.2.2. GOA 2
23.2.3. GOA 3
23.2.4. GOA 4
23.3. Autonomous Trains Market Volume (Units) & Value (US$ Bn) Analysis & Forecast, 2017-2031, By Train Type
23.3.1. Metro/Monorail
23.3.2. Light Rail
23.3.3. High-speed Rail/Bullet Train
23.4. Autonomous Trains Market Volume (Units) & Value (US$ Bn) Analysis & Forecast, 2017-2031, By Technology
23.4.1. CBTC
23.4.2. ERTMS
23.4.3. PTC
23.4.4. ATC
23.5. Autonomous Trains Market Volume (Units) & Value (US$ Bn) Analysis & Forecast, 2017-2031, By Component
23.5.1. Tachometer
23.5.2. Doppler
23.5.3. Accelerometer
23.5.4. Camera
23.5.5. Antenna
23.5.6. Radio Set
23.6. Autonomous Trains Market Volume (Units) & Value (US$ Bn) Analysis & Forecast, 2017-2031, By Application
23.6.1. Passenger Train
23.6.2. Freight Train
23.7. Key Country Analysis – South America Autonomous Trains Market Volume (Units) & Value (US$ Bn) Analysis & Forecast, 2017-2031
23.7.1. Brazil
23.7.2. Argentina
23.7.3. Rest of South America
24. Competitive Landscape
24.1. Company Share Analysis/ Brand Ranking, 2021
24.2. Key Player Strategy Analysis
24.2.1. Strategic Overview - Expansion, M&A, Partnership
24.2.2. Product & Marketing Strategy by Key Players
24.3. Autonomous Trains Market Key Player Pricing Analysis Based on –
24.3.1. Grade of Automation
24.3.2. Train Type
24.3.3. Application
24.4. Company Analysis for each player (Company Overview, Company Footprints, Production Locations, Product Portfolio, Competitors & Customers, Subsidiaries & Parent Organization, Recent Developments, Financial Analysis, Profitability, Revenue Share)
24.5. Company Profile/ Key Players
24.5.1. ABB
24.5.1.1. Company Overview
24.5.1.2. Company Footprints
24.5.1.3. Production Locations
24.5.1.4. Product Portfolio
24.5.1.5. Competitors & Customers
24.5.1.6. Subsidiaries & Parent Organization
24.5.1.7. Recent Developments
24.5.1.8. Financial Analysis
24.5.1.9. Profitability
24.5.1.10. Revenue Share
24.5.2. Alstom
24.5.2.1. Company Overview
24.5.2.2. Company Footprints
24.5.2.3. Production Locations
24.5.2.4. Product Portfolio
24.5.2.5. Competitors & Customers
24.5.2.6. Subsidiaries & Parent Organization
24.5.2.7. Recent Developments
24.5.2.8. Financial Analysis
24.5.2.9. Profitability
24.5.2.10. Revenue Share
24.5.3. American Equipment Company
24.5.3.1. Company Overview
24.5.3.2. Company Footprints
24.5.3.3. Production Locations
24.5.3.4. Product Portfolio
24.5.3.5. Competitors & Customers
24.5.3.6. Subsidiaries & Parent Organization
24.5.3.7. Recent Developments
24.5.3.8. Financial Analysis
24.5.3.9. Profitability
24.5.3.10. Revenue Share
24.5.4. Beijing Traffic Control Technology
24.5.4.1. Company Overview
24.5.4.2. Company Footprints
24.5.4.3. Production Locations
24.5.4.4. Product Portfolio
24.5.4.5. Competitors & Customers
24.5.4.6. Subsidiaries & Parent Organization
24.5.4.7. Recent Developments
24.5.4.8. Financial Analysis
24.5.4.9. Profitability
24.5.4.10. Revenue Share
24.5.5. Belden
24.5.5.1. Company Overview
24.5.5.2. Company Footprints
24.5.5.3. Production Locations
24.5.5.4. Product Portfolio
24.5.5.5. Competitors & Customers
24.5.5.6. Subsidiaries & Parent Organization
24.5.5.7. Recent Developments
24.5.5.8. Financial Analysis
24.5.5.9. Profitability
24.5.5.10. Revenue Share
24.5.6. Bharat Forge
24.5.6.1. Company Overview
24.5.6.2. Company Footprints
24.5.6.3. Production Locations
24.5.6.4. Product Portfolio
24.5.6.5. Competitors & Customers
24.5.6.6. Subsidiaries & Parent Organization
24.5.6.7. Recent Developments
24.5.6.8. Financial Analysis
24.5.6.9. Profitability
24.5.6.10. Revenue Share
24.5.7. Bombardier
24.5.7.1. Company Overview
24.5.7.2. Company Footprints
24.5.7.3. Production Locations
24.5.7.4. Product Portfolio
24.5.7.5. Competitors & Customers
24.5.7.6. Subsidiaries & Parent Organization
24.5.7.7. Recent Developments
24.5.7.8. Financial Analysis
24.5.7.9. Profitability
24.5.7.10. Revenue Share
24.5.8. CAF
24.5.8.1. Company Overview
24.5.8.2. Company Footprints
24.5.8.3. Production Locations
24.5.8.4. Product Portfolio
24.5.8.5. Competitors & Customers
24.5.8.6. Subsidiaries & Parent Organization
24.5.8.7. Recent Developments
24.5.8.8. Financial Analysis
24.5.8.9. Profitability
24.5.8.10. Revenue Share
24.5.9. Calamp
24.5.9.1. Company Overview
24.5.9.2. Company Footprints
24.5.9.3. Production Locations
24.5.9.4. Product Portfolio
24.5.9.5. Competitors & Customers
24.5.9.6. Subsidiaries & Parent Organization
24.5.9.7. Recent Developments
24.5.9.8. Financial Analysis
24.5.9.9. Profitability
24.5.9.10. Revenue Share
24.5.10. CRRC
24.5.10.1. Company Overview
24.5.10.2. Company Footprints
24.5.10.3. Production Locations
24.5.10.4. Product Portfolio
24.5.10.5. Competitors & Customers
24.5.10.6. Subsidiaries & Parent Organization
24.5.10.7. Recent Developments
24.5.10.8. Financial Analysis
24.5.10.9. Profitability
24.5.10.10. Revenue Share
24.5.11. Deuta
24.5.11.1. Company Overview
24.5.11.2. Company Footprints
24.5.11.3. Production Locations
24.5.11.4. Product Portfolio
24.5.11.5. Competitors & Customers
24.5.11.6. Subsidiaries & Parent Organization
24.5.11.7. Recent Developments
24.5.11.8. Financial Analysis
24.5.11.9. Profitability
24.5.11.10. Revenue Share
24.5.12. Deutsche Bahn
24.5.12.1. Company Overview
24.5.12.2. Company Footprints
24.5.12.3. Production Locations
24.5.12.4. Product Portfolio
24.5.12.5. Competitors & Customers
24.5.12.6. Subsidiaries & Parent Organization
24.5.12.7. Recent Developments
24.5.12.8. Financial Analysis
24.5.12.9. Profitability
24.5.12.10. Revenue Share
24.5.13. General Electric
24.5.13.1. Company Overview
24.5.13.2. Company Footprints
24.5.13.3. Production Locations
24.5.13.4. Product Portfolio
24.5.13.5. Competitors & Customers
24.5.13.6. Subsidiaries & Parent Organization
24.5.13.7. Recent Developments
24.5.13.8. Financial Analysis
24.5.13.9. Profitability
24.5.13.10. Revenue Share
24.5.14. Hitachi
24.5.14.1. Company Overview
24.5.14.2. Company Footprints
24.5.14.3. Production Locations
24.5.14.4. Product Portfolio
24.5.14.5. Competitors & Customers
24.5.14.6. Subsidiaries & Parent Organization
24.5.14.7. Recent Developments
24.5.14.8. Financial Analysis
24.5.14.9. Profitability
24.5.14.10. Revenue Share
24.5.15. Hollysys
24.5.15.1. Company Overview
24.5.15.2. Company Footprints
24.5.15.3. Production Locations
24.5.15.4. Product Portfolio
24.5.15.5. Competitors & Customers
24.5.15.6. Subsidiaries & Parent Organization
24.5.15.7. Recent Developments
24.5.15.8. Financial Analysis
24.5.15.9. Profitability
24.5.15.10. Revenue Share
24.5.16. Ingeteam
24.5.16.1. Company Overview
24.5.16.2. Company Footprints
24.5.16.3. Production Locations
24.5.16.4. Product Portfolio
24.5.16.5. Competitors & Customers
24.5.16.6. Subsidiaries & Parent Organization
24.5.16.7. Recent Developments
24.5.16.8. Financial Analysis
24.5.16.9. Profitability
24.5.16.10. Revenue Share
24.5.17. Intesens
24.5.17.1. Company Overview
24.5.17.2. Company Footprints
24.5.17.3. Production Locations
24.5.17.4. Product Portfolio
24.5.17.5. Competitors & Customers
24.5.17.6. Subsidiaries & Parent Organization
24.5.17.7. Recent Developments
24.5.17.8. Financial Analysis
24.5.17.9. Profitability
24.5.17.10. Revenue Share
24.5.18. Kawasaki Heavy Industries
24.5.18.1. Company Overview
24.5.18.2. Company Footprints
24.5.18.3. Production Locations
24.5.18.4. Product Portfolio
24.5.18.5. Competitors & Customers
24.5.18.6. Subsidiaries & Parent Organization
24.5.18.7. Recent Developments
24.5.18.8. Financial Analysis
24.5.18.9. Profitability
24.5.18.10. Revenue Share
24.5.19. Mitsubishi Heavy Industries
24.5.19.1. Company Overview
24.5.19.2. Company Footprints
24.5.19.3. Production Locations
24.5.19.4. Product Portfolio
24.5.19.5. Competitors & Customers
24.5.19.6. Subsidiaries & Parent Organization
24.5.19.7. Recent Developments
24.5.19.8. Financial Analysis
24.5.19.9. Profitability
24.5.19.10. Revenue Share
24.5.20. Siemens
24.5.20.1. Company Overview
24.5.20.2. Company Footprints
24.5.20.3. Production Locations
24.5.20.4. Product Portfolio
24.5.20.5. Competitors & Customers
24.5.20.6. Subsidiaries & Parent Organization
24.5.20.7. Recent Developments
24.5.20.8. Financial Analysis
24.5.20.9. Profitability
24.5.20.10. Revenue Share
24.5.21. Tech Mahindra Ltd.
24.5.21.1. Company Overview
24.5.21.2. Company Footprints
24.5.21.3. Production Locations
24.5.21.4. Product Portfolio
24.5.21.5. Competitors & Customers
24.5.21.6. Subsidiaries & Parent Organization
24.5.21.7. Recent Developments
24.5.21.8. Financial Analysis
24.5.21.9. Profitability
24.5.21.10. Revenue Share
24.5.22. Thales Group
24.5.22.1. Company Overview
24.5.22.2. Company Footprints
24.5.22.3. Production Locations
24.5.22.4. Product Portfolio
24.5.22.5. Competitors & Customers
24.5.22.6. Subsidiaries & Parent Organization
24.5.22.7. Recent Developments
24.5.22.8. Financial Analysis
24.5.22.9. Profitability
24.5.22.10. Revenue Share
24.5.23. Transmashholding
24.5.23.1. Company Overview
24.5.23.2. Company Footprints
24.5.23.3. Production Locations
24.5.23.4. Product Portfolio
24.5.23.5. Competitors & Customers
24.5.23.6. Subsidiaries & Parent Organization
24.5.23.7. Recent Developments
24.5.23.8. Financial Analysis
24.5.23.9. Profitability
24.5.23.10. Revenue Share
24.5.24. Tvema
24.5.24.1. Company Overview
24.5.24.2. Company Footprints
24.5.24.3. Production Locations
24.5.24.4. Product Portfolio
24.5.24.5. Competitors & Customers
24.5.24.6. Subsidiaries & Parent Organization
24.5.24.7. Recent Developments
24.5.24.8. Financial Analysis
24.5.24.9. Profitability
24.5.24.10. Revenue Share
24.5.25. Wabtec Corporation
24.5.25.1. Company Overview
24.5.25.2. Company Footprints
24.5.25.3. Production Locations
24.5.25.4. Product Portfolio
24.5.25.5. Competitors & Customers
24.5.25.6. Subsidiaries & Parent Organization
24.5.25.7. Recent Developments
24.5.25.8. Financial Analysis
24.5.25.9. Profitability
24.5.25.10. Revenue Share
24.5.26. Other Key Players
24.5.26.1. Company Overview
24.5.26.2. Company Footprints
24.5.26.3. Production Locations
24.5.26.4. Product Portfolio
24.5.26.5. Competitors & Customers
24.5.26.6. Subsidiaries & Parent Organization
24.5.26.7. Recent Developments
24.5.26.8. Financial Analysis
24.5.26.9. Profitability
24.5.26.10. Revenue Share
25. Autonomous Trains Market – Primary Insights
List of Tables
Table 1: Global Autonomous Trains Market Volume (Units) & Value (US$ Bn) Forecast, by Grade of Automation, 2017-2031
Table 2: Global Autonomous Trains Market Volume (Units) & Value (US$ Bn) Forecast, by Train Type, 2017-2031
Table 3: Global Autonomous Trains Market Volume (Units) & Value (US$ Bn) Forecast, by Technology, 2017-2031
Table 4: Global Autonomous Trains Market Volume (Units) & Value (US$ Bn) Forecast, by Component, 2017-2031
Table 5: Global Autonomous Trains Market Volume (Units) & Value (US$ Bn) Forecast, by Track Length, 2017-2031
Table 6: Global Autonomous Trains Market Volume (Units) & Value (US$ Bn) Forecast, by Application, 2017-2031
Table 7: Global Autonomous Trains Market Volume (Units) & Value (US$ Bn) Forecast, by Region, 2017-2031
Table 8: North America Autonomous Trains Market Volume (Units) & Value (US$ Bn) Forecast, by Grade of Automation, 2017-2031
Table 9: North America Autonomous Trains Market Volume (Units) & Value (US$ Bn) Forecast, by Train Type, 2017-2031
Table 10: North America Autonomous Trains Market Volume (Units) & Value (US$ Bn) Forecast, by Technology, 2017-2031
Table 11: North America Autonomous Trains Market Volume (Units) & Value (US$ Bn) Forecast, by Component, 2017-2031
Table 12: North America Autonomous Trains Market Volume (Units) & Value (US$ Bn) Forecast, by Track Length, 2017-2031
Table 13: North America Autonomous Trains Market Volume (Units) & Value (US$ Bn) Forecast, by Application, 2017-2031
Table 14: North America Autonomous Trains Market Volume (Units) & Value (US$ Bn) Forecast, by Region, 2017-2031
Table 15: Europe Autonomous Trains Market Volume (Units) & Value (US$ Bn) Forecast, by Grade of Automation, 2017-2031
Table 16: Europe Autonomous Trains Market Volume (Units) & Value (US$ Bn) Forecast, by Train Type, 2017-2031
Table 17: Europe Autonomous Trains Market Volume (Units) & Value (US$ Bn) Forecast, by Technology, 2017-2031
Table 18: Europe Autonomous Trains Market Volume (Units) & Value (US$ Bn) Forecast, by Component, 2017-2031
Table 19: Europe Autonomous Trains Market Volume (Units) & Value (US$ Bn) Forecast, by Track Length, 2017-2031
Table 20: Europe Autonomous Trains Market Volume (Units) & Value (US$ Bn) Forecast, by Application, 2017-2031
Table 21: Europe Autonomous Trains Market Volume (Units) & Value (US$ Bn) Forecast, by Region, 2017-2031
Table 22: Asia Pacific Autonomous Trains Market Volume (Units) & Value (US$ Bn) Forecast, by Grade of Automation, 2017-2031
Table 23: Asia Pacific Autonomous Trains Market Volume (Units) & Value (US$ Bn) Forecast, by Train Type, 2017-2031
Table 24: Asia Pacific Autonomous Trains Market Volume (Units) & Value (US$ Bn) Forecast, by Technology, 2017-2031
Table 25: Asia Pacific Autonomous Trains Market Volume (Units) & Value (US$ Bn) Forecast, by Component, 2017-2031
Table 26: Asia Pacific Autonomous Trains Market Volume (Units) & Value (US$ Bn) Forecast, by Track Length, 2017-2031
Table 27: Asia Pacific Autonomous Trains Market Volume (Units) & Value (US$ Bn) Forecast, by Application, 2017-2031
Table 28: Asia Pacific Autonomous Trains Market Volume (Units) & Value (US$ Bn) Forecast, by Region, 2017-2031
Table 29: Middle East & Africa Autonomous Trains Market Volume (Units) & Value (US$ Bn) Forecast, by Grade of Automation, 2017-2031
Table 30: Middle East & Africa Autonomous Trains Market Volume (Units) & Value (US$ Bn) Forecast, by Train Type, 2017-2031
Table 31: Middle East & Africa Autonomous Trains Market Volume (Units) & Value (US$ Bn) Forecast, by Technology, 2017-2031
Table 32: Middle East & Africa Autonomous Trains Market Volume (Units) & Value (US$ Bn) Forecast, by Component, 2017-2031
Table 33: Middle East & Africa Autonomous Trains Market Volume (Units) & Value (US$ Bn) Forecast, by Track Length, 2017-2031
Table 34: Middle East & Africa Autonomous Trains Market Volume (Units) & Value (US$ Bn) Forecast, by Application, 2017-2031
Table 35: Middle East & Africa Autonomous Trains Market Volume (Units) & Value (US$ Bn) Forecast, by Region, 2017-2031
Table 36: South America Autonomous Trains Market Volume (Units) & Value (US$ Bn) Forecast, by Grade of Automation, 2017-2031
Table 37: South America Autonomous Trains Market Volume (Units) & Value (US$ Bn) Forecast, by Train Type, 2017-2031
Table 38: South America Autonomous Trains Market Volume (Units) & Value (US$ Bn) Forecast, by Technology, 2017-2031
Table 39: South America Autonomous Trains Market Volume (Units) & Value (US$ Bn) Forecast, by Component, 2017-2031
Table 40: South America Autonomous Trains Market Volume (Units) & Value (US$ Bn) Forecast, by Track Length, 2017-2031
Table 41: South America Autonomous Trains Market Volume (Units) & Value (US$ Bn) Forecast, by Application, 2017-2031
Table 42: South America Autonomous Trains Market Volume (Units) & Value (US$ Bn) Forecast, by Region, 2017-2031
List of Figures
Figure 1: Global Autonomous Trains Market, Incremental Opportunity, by Application, (US$ Bn), 2022-2031
Figure 2: Global Autonomous Trains Market Volume (Units) & Value (US$ Bn) Forecast, by Region, 2017-2031
Figure 3: Global Autonomous Trains Market, Incremental Opportunity, by Region, (US$ Bn), 2022-2031
Figure 4: North America Autonomous Trains Market Volume (Units) & Value (US$ Bn) Forecast, by Grade of Automation, 2017-2031
Figure 5: North America Autonomous Trains Market, Incremental Opportunity, by Grade of Automation, (US$ Bn), 2022-2031
Figure 6: North America Autonomous Trains Market Volume (Units) & Value (US$ Bn) Forecast, by Train Type, 2017-2031
Figure 7: North America Autonomous Trains Market, Incremental Opportunity, by Train Type, (US$ Bn), 2022-2031
Figure 8: North America Autonomous Trains Market Volume (Units) & Value (US$ Bn) Forecast, by Technology, 2017-2031
Figure 9: North America Autonomous Trains Market, Incremental Opportunity, by Technology, (US$ Bn), 2022-2031
Figure 10: North America Autonomous Trains Market Volume (Units) & Value (US$ Bn) Forecast, by Component, 2017-2031
Figure 11: North America Autonomous Trains Market, Incremental Opportunity, by Component, (US$ Bn), 2022-2031
Figure 12: North America Autonomous Trains Market Volume (Units) & Value (US$ Bn) Forecast, by Track Length, 2017-2031
Figure 13: North America Autonomous Trains Market, Incremental Opportunity, by Track Length, (US$ Bn), 2022-2031
Figure 14: North America Autonomous Trains Market Volume (Units) & Value (US$ Bn) Forecast, by Application, 2017-2031
Figure 15: North America Autonomous Trains Market, Incremental Opportunity, by Application, (US$ Bn), 2022-2031
Figure 16: North America Autonomous Trains Market Volume (Units) & Value (US$ Bn) Forecast, by Region, 2017-2031
Figure 17: North America Autonomous Trains Market, Incremental Opportunity, by Region, (US$ Bn), 2022-2031
Figure 18: Europe Autonomous Trains Market Volume (Units) & Value (US$ Bn) Forecast, by Grade of Automation, 2017-2031
Figure 19: Europe Autonomous Trains Market, Incremental Opportunity, by Grade of Automation, (US$ Bn), 2022-2031
Figure 20: Europe Autonomous Trains Market Volume (Units) & Value (US$ Bn) Forecast, by Train Type, 2017-2031
Figure 21: Europe Autonomous Trains Market, Incremental Opportunity, by Train Type, (US$ Bn), 2022-2031
Figure 22: Europe Autonomous Trains Market Volume (Units) & Value (US$ Bn) Forecast, by Technology, 2017-2031
Figure 23: Europe Autonomous Trains Market, Incremental Opportunity, by Technology, (US$ Bn), 2022-2031
Figure 24: Europe Autonomous Trains Market Volume (Units) & Value (US$ Bn) Forecast, by Component, 2017-2031
Figure 25: Europe Autonomous Trains Market, Incremental Opportunity, by Component, (US$ Bn), 2022-2031
Figure 26: Europe Autonomous Trains Market Volume (Units) & Value (US$ Bn) Forecast, by Track Length, 2017-2031
Figure 27: Europe Autonomous Trains Market, Incremental Opportunity, by Track Length, (US$ Bn), 2022-2031
Figure 28: Europe Autonomous Trains Market Volume (Units) & Value (US$ Bn) Forecast, by Application, 2017-2031
Figure 29: Europe Autonomous Trains Market, Incremental Opportunity, by Application, (US$ Bn), 2022-2031
Figure 30: Europe Autonomous Trains Market Volume (Units) & Value (US$ Bn) Forecast, by Region, 2017-2031
Figure 31: Europe Autonomous Trains Market, Incremental Opportunity, by Region, (US$ Bn), 2022-2031
Figure 32: Asia Pacific Autonomous Trains Market Volume (Units) & Value (US$ Bn) Forecast, by Grade of Automation, 2017-2031
Figure 33: Asia Pacific Autonomous Trains Market, Incremental Opportunity, by Grade of Automation, (US$ Bn), 2022-2031
Figure 34: Asia Pacific Autonomous Trains Market Volume (Units) & Value (US$ Bn) Forecast, by Train Type, 2017-2031
Figure 35: Asia Pacific Autonomous Trains Market, Incremental Opportunity, by Train Type, (US$ Bn), 2022-2031
Figure 36: Asia Pacific Autonomous Trains Market Volume (Units) & Value (US$ Bn) Forecast, by Technology, 2017-2031
Figure 37: Asia Pacific Autonomous Trains Market, Incremental Opportunity, by Technology, (US$ Bn), 2022-2031
Figure 38: Asia Pacific Autonomous Trains Market Volume (Units) & Value (US$ Bn) Forecast, by Component, 2017-2031
Figure 39: Asia Pacific Autonomous Trains Market, Incremental Opportunity, by Component, (US$ Bn), 2022-2031
Figure 40: Asia Pacific Autonomous Trains Market Volume (Units) & Value (US$ Bn) Forecast, by Track Length, 2017-2031
Figure 41: Asia Pacific Autonomous Trains Market, Incremental Opportunity, by Track Length, (US$ Bn), 2022-2031
Figure 42: Asia Pacific Autonomous Trains Market Volume (Units) & Value (US$ Bn) Forecast, by Application, 2017-2031
Figure 43: Asia Pacific Autonomous Trains Market, Incremental Opportunity, by Application, (US$ Bn), 2022-2031
Figure 44: Asia Pacific Autonomous Trains Market Volume (Units) & Value (US$ Bn) Forecast, by Region, 2017-2031
Figure 45: Asia Pacific Autonomous Trains Market, Incremental Opportunity, by Region, (US$ Bn), 2022-2031
Figure 46: Middle East & Africa Autonomous Trains Market Volume (Units) & Value (US$ Bn) Forecast, by Grade of Automation, 2017-2031
Figure 47: Middle East & Africa Autonomous Trains Market, Incremental Opportunity, by Grade of Automation, (US$ Bn), 2022-2031
Figure 48: Middle East & Africa Autonomous Trains Market Volume (Units) & Value (US$ Bn) Forecast, by Train Type, 2017-2031
Figure 49: Middle East & Africa Autonomous Trains Market, Incremental Opportunity, by Train Type, (US$ Bn), 2022-2031
Figure 50: Middle East & Africa Autonomous Trains Market Volume (Units) & Value (US$ Bn) Forecast, by Technology, 2017-2031
Figure 51: Middle East & Africa Autonomous Trains Market, Incremental Opportunity, by Technology, (US$ Bn), 2022-2031
Figure 52: Middle East & Africa Autonomous Trains Market Volume (Units) & Value (US$ Bn) Forecast, by Component, 2017-2031
Figure 53: Middle East & Africa Autonomous Trains Market, Incremental Opportunity, by Component, (US$ Bn), 2022-2031
Figure 54: Middle East & Africa Autonomous Trains Market Volume (Units) & Value (US$ Bn) Forecast, by Track Length, 2017-2031
Figure 55: Middle East & Africa Autonomous Trains Market, Incremental Opportunity, by Track Length, (US$ Bn), 2022-2031
Figure 56: Middle East & Africa Autonomous Trains Market Volume (Units) & Value (US$ Bn) Forecast, by Application, 2017-2031
Figure 57: Middle East & Africa Autonomous Trains Market, Incremental Opportunity, by Application, (US$ Bn), 2022-2031
Figure 58: Middle East & Africa Autonomous Trains Market Volume (Units) & Value (US$ Bn) Forecast, by Region, 2017-2031
Figure 59: Middle East & Africa Autonomous Trains Market, Incremental Opportunity, by Region, (US$ Bn), 2022-2031
Figure 60: South America Autonomous Trains Market Volume (Units) & Value (US$ Bn) Forecast, by Grade of Automation, 2017-2031
Figure 61: South America Autonomous Trains Market, Incremental Opportunity, by Grade of Automation, (US$ Bn), 2022-2031
Figure 62: South America Autonomous Trains Market Volume (Units) & Value (US$ Bn) Forecast, by Train Type, 2017-2031
Figure 63: South America Autonomous Trains Market, Incremental Opportunity, by Train Type, (US$ Bn), 2022-2031
Figure 64: South America Autonomous Trains Market Volume (Units) & Value (US$ Bn) Forecast, by Technology, 2017-2031
Figure 65: South America Autonomous Trains Market, Incremental Opportunity, by Technology, (US$ Bn), 2022-2031
Figure 66: South America Autonomous Trains Market Volume (Units) & Value (US$ Bn) Forecast, by Component, 2017-2031
Figure 67: South America Autonomous Trains Market, Incremental Opportunity, by Component, (US$ Bn), 2022-2031
Figure 68: South America Autonomous Trains Market Volume (Units) & Value (US$ Bn) Forecast, by Track Length, 2017-2031
Figure 69: South America Autonomous Trains Market, Incremental Opportunity, by Track Length, (US$ Bn), 2022-2031
Figure 70: South America Autonomous Trains Market Volume (Units) & Value (US$ Bn) Forecast, by Application, 2017-2031
Figure 71: South America Autonomous Trains Market, Incremental Opportunity, by Application, (US$ Bn), 2022-2031
Figure 72: South America Autonomous Trains Market Volume (Units) & Value (US$ Bn) Forecast, by Region, 2017-2031
Figure 73: South America Autonomous Trains Market, Incremental Opportunity, by Region, (US$ Bn), 2022-2031
Copyright © Transparency Market Research, Inc. All Rights reserved
Trust Online


Autonomous Trains Market