
Tools used in VR content creation help in the creation of virtual assets such as applications and cinematic views. The advent of VR tools is therefore considered a major breakthrough, which enabled people present 3D ideas and design more efficiently than ever. VR content creation tools can put targeted audience into the world of virtual entertainment, which is idea behind designing more interesting and interactive contents. VR content creation includes the development of sketch, pre-production activities, shoot, and post-production. In order to create virtual reality content, enterprises engaged in VR content creation use advance software and cameras. Driven by these factors, the global VR content creation market is forecast to witness strong growth in the coming years.
According to Transparency Market Research (TMR), the global VR content creation market is likely to exhibit a CAGR of 89.8% between 2016 and 2024. At this pace, the market is expected to reach a whopping US$41.01 bn by the end of 2024 from a valuation of US$147.5 mn in 2015.
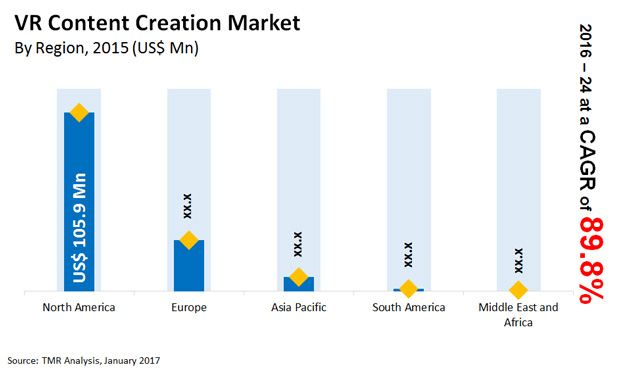
Regionally, North America emerged dominant in the global VR content creation market with a share of 73.4% in 2016. The prevalent gaming culture in the region, especially in the U.S., and the rising adoption of novel technologies such as virtual reality have aided the expansion of the VR content creation market in North America. As consumers are more interested towards immersive experience they are receiving through the integration of virtual reality, the demand for VR content creation is forecast to increase further in the region.
However, over the course of the forecast period Asia Pacific is forecast to exhibit higher growth. TMR has projected the region to exhibit an exponential CAGR of 116.1% between 2016 and 2024. This regional market will gain from the rising awareness about virtual reality in the region and the entry of new players.
The global VR content creation market can be segmented based on content type, end use, and solution. Among the end users constituting travel, hospitality, and event, real estate, media and entertainment, retail, gaming, and automotive sectors, the gaming industry is exhibiting the most lucrative opportunities. This industry therefore enjoyed lead in the overall market in 2015. In addition, the recent technological advancements are expected to seal the dominance of the gaming sector in the overall market.
During the next few years, the use of VR content creation is also likely to increase across media and entertainment, and travel, hospitality, and event sectors. Moreover, the automotive industry is forecast to showcase attractive opportunities. The market is expected to gain traction as the adoption of immersive and 360 degree videos increase in the retail sector. Big retail brands are expected to use VR content creation to improve the overall consumer experience. Spurred by these factors the global VR content creation market is expected to report strong growth in the coming years.
Some of the companies to benefit from the aforementioned trends are Koncept VR, VOXELUS, SubVRsive, Panedia Pty Ltd., WEMAKEVR, 360 Labs, MATTERVR and Elysian Studio Private Limited (Meraki).
The growth of the VR content creation market witnessed an upward trajectory during the outbreak of the COVID-19 pandemic. As governments induced lockdowns and travel restrictions, more and more people stayed indoors. This prompted them to consume more digital content in order to pass time and for entertainment and education as well. With e-commerce sector booming during the pandemic because of requirement of essential and other items, VR console sets also witnessed a promising growth.
Content creators across digital channels came up with new and innovative ideas to produce and publish their content online. VR content played a huge role in keeping global masses entertained. As such, there was an increased demand for more immersive and experience rich content. This has helped drive the market during the peak months of the COVID-19 outbreak.
The virtual reality content creation tools are widely used as an open source platform to create immersive experience content. These tools are developed to be user friendly, hence the adoption of virtual reality content creation is expected to rise at a high rate during the forecast period. North America dominated the overall virtual reality content creation market growth in 2018, as several major players are operating from this region, owing to availability of well-developed IT infrastructure. North America dominated the overall virtual reality content creation market in 2018, as several major players are operating from this region, owing to availability of well-developed IT infrastructure.
Increasing demand for the head mounted displays such as AR and VR products among people across the world and easy availability of cost effective VR devices in the entertainment and gaming sector have also played a key role in driving the growth of the global VR content creation market. As the world moves towards increased digitalization, the market is expected to witness even more promising growth in the coming years.
Global VR Content Creation Market
|
By Content Type |
|
|
By Solution |
|
|
By End-Use Sector |
|
1. Preface
1.1. Market Definition and Scope
1.2. Market Segmentation
1.3. Key Research Objectives
1.4. Research Highlights
2. Assumptions and Research Methodology
3. Executive Summary : VR Content Creation Market
4. Market Overview
4.1. Introduction
4.1.1. Definition
4.1.2. Evolution/Development
4.2. Market Dynamics
4.2.1. Drivers
4.2.2. Restraints
4.2.3. Opportunities
4.3. Global VR Content Creation Market Analysis and Forecasts, 2014 – 2024
4.3.1. Market Revenue Projection (US$ Mn))
4.4. Porter’s Five Force Analysis
4.5. Market Outlook
5. Global VR Content Creation Market Analysis and Forecasts, By Content Type
5.1. Introduction & Definitions
5.2. Key Findings/Developments
5.3. Key Trends
5.4. Market Size (US$ Mn) Forecast By Content Type, 2014 - 2024
5.4.1. Videos
5.4.1.1. 360 Degree
5.4.1.2. Immersive
5.4.2. 360 Degree Photos
5.4.3. Games
5.5. Content Type Comparison Matrix
5.6. Market Attractiveness By Content Type
6. Global VR Content Creation Market Analysis and Forecasts, By Solution
6.1. Introduction & Definition
6.2. Key Findings/Developments
6.3. Key Trends
6.4. Market Size (US$ Mn) Forecast By Solution, 2014 - 2020
6.4.1. Software/Application
6.4.2. Services
6.5. Solution Comparison Matrix
6.6. Market Attractiveness By Solution
7. Global VR Content Creation Market Analysis and Forecasts, By End-Use Sector
7.1. Introduction & Definition
7.2. Key Findings/ Developments
7.3. Key Trends
7.4. Market Size (US$ Mn) Forecast By End-use Sector, 2014 - 2024
7.4.1. Real-Estate
7.4.2. Travel, Hospitality and Events
7.4.3. Media and Entertainment
7.4.4. Retail
7.4.5. Gaming
7.4.6. Automotive
7.4.7. Others
7.5. End-use Sector Comparison Matrix
7.6. Market Attractiveness By End-use Sector
8. Global VR Content Creation Market Analysis and Forecasts, By Region
8.1. Key Findings
8.2. Market Size (US$ Mn) Forecast By Region, 2014 - 2020
8.2.1. North America
8.2.2. Europe
8.2.3. Asia-Pacific
8.2.4. Middle-East and Africa
8.2.5. South America
8.3. Market Attractiveness By Region
9. North America VR Content Creation Market Analysis and Forecast
9.1. Key Findings
9.2. Key Trends
9.3. Market Size (US$ Mn) Forecast By Content Type, 2014 - 2024
9.3.1. Videos
9.3.1.1. 360 Degree
9.3.1.2. Immersive
9.3.2. 360 Degree Photos
9.3.3. Games
9.4. Market Size (US$ Mn) Forecast By Solution, 2014 - 2024
9.4.1. Software/Application
9.4.2. Services
9.5. Market Size (US$ Mn) Forecast By End-use Sector, 2014 - 2024
9.5.1. Real-Estate
9.5.2. Travel, Hospitality and Events
9.5.3. Media and Entertainment
9.5.4. Retail
9.5.5. Gaming
9.5.6. Automotive
9.5.7. Others
9.6. Market Size (US$ Mn) Forecast By Country
9.6.1. The U.S.
9.6.2. Canada
9.6.3. Res of North America
9.7. Market Attractiveness Analysis
9.7.1. By Country
9.7.2. By Content Type
9.7.3. By Solution
9.7.4. By End-use Sector
10. Europe VR Content Creation Market Analysis and Forecast
10.1. Key Findings
10.2. Key Trends
10.3. Market Size (US$ Mn) Forecast By Content Type, 2014 - 2024
10.3.1. Videos
10.3.1.1. 360 Degree
10.3.1.2. Immersive
10.3.2. 360 Degree Photos
10.3.3. Games
10.4. Market Size (US$ Mn) Forecast By Solution, 2014 - 2024
10.4.1. Software/Application
10.4.2. Services
10.5. Market Size (US$ Mn) Forecast By End-use Sector, 2014 - 2024
10.5.1. Real-Estate
10.5.2. Travel, Hospitality and Events
10.5.3. Media and Entertainment
10.5.4. Retail
10.5.5. Gaming
10.5.6. Automotive
10.5.7. Others
10.6. Market Size (US$ Mn) Forecast By Country
10.6.1. The U.K
10.6.2. France
10.6.3. Rest of Europe,
10.7. Market Attractiveness Analysis
10.7.1. By Country
10.7.2. By Content Type
10.7.3. By Solution
10.7.4. By End-use Sector
11. Asia-Pacific VR Content Creation Market Analysis and Forecast
11.1. Key Findings
11.2. Key Trends
11.3. Market Size (US$ Mn) Forecast By Content Type, 2014 - 2024
11.3.1. Videos
11.3.1.1. 360 Degree
11.3.1.2. Immersive
11.3.2. 360 Degree Photos
11.3.3. Games
11.4. Market Size (US$ Mn) Forecast By Solution, 2014 - 2024
11.4.1. Software/Application
11.4.2. Services
11.5. Market Size (US$ Mn) Forecast By End-use Sector, 2014 - 2024
11.5.1. Real-Estate
11.5.2. Travel, Hospitality and Events
11.5.3. Media and Entertainment
11.5.4. Retail
11.5.5. Gaming
11.5.6. Automotive
11.5.7. Others
11.6. Market Size (US$ Mn) Forecast By Country
11.6.1. China
11.6.2. Japan
11.6.3. India
11.6.4. Australia
11.6.5. Res of Asia-Pacific
11.7. Market Attractiveness Analysis
11.7.1. By Country
11.7.2. By Content Type
11.7.3. By Solution
11.7.4. By End-use Sector
12. Middle-East and Africa VR Content Creation Market Analysis and Forecast
12.1. Key Findings
12.2. Key Trends
12.3. Market Size (US$ Mn) Forecast By Content Type, 2014 - 2024
12.3.1. Videos
12.3.1.1. 360 Degree
12.3.1.2. Immersive
12.3.2. 360 Degree Photos
12.3.3. Games
12.4. Market Size (US$ Mn) Forecast By Solution, 2014 - 2024
12.4.1. Software/Application
12.4.2. Services
12.5. Market Size (US$ Mn) Forecast By End-use Sector, 2014 - 2024
12.5.1. Real-Estate
12.5.2. Travel, Hospitality and Events
12.5.3. Media and Entertainment
12.5.4. Retail
12.5.5. Gaming
12.5.6. Automotive
12.5.7. Others
12.6. Market Size (US$ Mn) Forecast By Country
12.6.1. GCC
12.6.2. South Africa
12.6.3. Res of MEA
12.7. Market Attractiveness Analysis
12.7.1. By Country
12.7.2. By Content Type
12.7.3. By Solution
12.7.4. By End-use Sector
13. South America VR Content Creation Market Analysis and Forecast
13.1. Key Findings
13.2. Key Trends
13.3. Market Size (US$ Mn) Forecast By Content Type, 2014 - 2024
13.3.1. Videos
13.3.1.1. 360 Degree
13.3.1.2. Immersive
13.3.2. 360 Degree Photos
13.3.3. Games
13.4. Market Size (US$ Mn) Forecast By Solution, 2014 - 2024
13.4.1. Software/Application
13.4.2. Services
13.5. Market Size (US$ Mn) Forecast By End-use Sector, 2014 - 2024
13.5.1. Real-Estate
13.5.2. Travel, Hospitality and Events
13.5.3. Media and Entertainment
13.5.4. Retail
13.5.5. Gaming
13.5.6. Automotive
13.5.7. Others
13.6. Market Size (US$ Mn) Forecast By Country
13.6.1. Brazil
13.6.2. Argentina
13.6.3. Rest of South America
13.7. Market Attractiveness Analysis
13.7.1. By Country
13.7.2. By Content Type
13.7.3. By Solution
13.7.4. By End-use Sector
14. Competition Landscape
14.1. Market Player – Competition Matrix
14.2. Market Share Analysis By Company (2015)
14.3. Company Profiles (Details – Overview, Financials, SWOT Analysis, Strategy)
14.3.1. Matterport
14.3.1.1. Company Details (HQ, Foundation Year, Revenue, Employee Strength)
14.3.1.2. Company Description
14.3.1.3. SWOT Analysis
14.3.1.4. Strategic Overview
14.3.2. Wevr
14.3.2.1. Company Details (HQ, Foundation Year, Revenue, Employee Strength)
14.3.2.2. Company Description
14.3.2.3. SWOT Analysis
14.3.2.4. Strategic Overview
14.3.3. Vizor
14.3.3.1. Company Details (HQ, Foundation Year, Revenue, Employee Strength)
14.3.3.2. Company Description
14.3.3.3. SWOT Analysis
14.3.3.4. Strategic Overview
14.3.4. Koncept VR
14.3.4.1. Company Details (HQ, Foundation Year, Revenue, Employee Strength)
14.3.4.2. Company Description
14.3.4.3. SWOT Analysis
14.3.4.4. Strategic Overview
14.3.5. VOXELUS
14.3.5.1. Company Details (HQ, Foundation Year, Revenue, Employee Strength)
14.3.5.2. Company Description
14.3.5.3. SWOT Analysis
14.3.5.4. Strategic Overview
14.3.6. SubVRsive
14.3.6.1. Company Details (HQ, Foundation Year, Revenue, Employee Strength)
14.3.6.2. Company Description
14.3.6.3. SWOT Analysis
14.3.6.4. Strategic Overview
14.3.7. Panedia Pty Ltd
14.3.7.1. Company Details (HQ, Foundation Year, Revenue, Employee Strength)
14.3.7.2. Company Description
14.3.7.3. SWOT Analysis
14.3.7.4. Strategic Overview
14.3.8. WEMAKEVR
14.3.8.1. Company Details (HQ, Foundation Year, Revenue, Employee Strength)
14.3.8.2. Company Description
14.3.8.3. SWOT Analysis
14.3.8.4. Strategic Overview
14.3.9. 360 Labs
14.3.9.1. Company Details (HQ, Foundation Year, Revenue, Employee Strength)
14.3.9.2. Company Description
14.3.9.3. SWOT Analysis
14.3.9.4. Strategic Overview
14.3.10. MATTERVR
14.3.10.1. Company Details (HQ, Foundation Year, Revenue, Employee Strength)
14.3.10.2. Company Description
14.3.10.3. SWOT Analysis
14.3.10.4. Strategic Overview
14.3.11. Elysian Studio Private Limited (Meraki)
14.3.11.1. Company Details (HQ, Foundation Year, Revenue, Employee Strength)
14.3.11.2. Company Description
14.3.11.3. SWOT Analysis
14.3.11.4. Strategic Overview
14.3.12. Blippar
14.3.12.1. Company Details (HQ, Foundation Year, Revenue, Employee Strength)
14.3.12.2. Company Description
14.3.12.3. SWOT Analysis
14.3.12.4. Strategic Overview
15. Key Takeaways
List of Tables
Table 1: Global VR Content Creation Market Forecast, By Content Type, 2014 – 2024 (US$ Mn)
Table 2: Global VR Content Creation Market Forecast, By Videos, 2014 – 2024 (US$ Mn)
Table 3: Global VR Content Creation Market Forecast, By Solution, 2014 – 2024 (US$ Mn)
Table 4: Global VR Content Creation Market Forecast, By End-Use Sector, 2014 – 2024 (US$ Mn)
Table 5: Global VR Content Creation Market Forecast, By Region, 2014 – 2024 (US$ Mn)
Table 6: North America VR Content Creation Market Forecast, By Content Type, 2014 – 2024 (US$ Mn)
Table 7: North America VR Content Creation Market Forecast, By Videos, 2014 – 2024 (US$ Mn)
Table 8: North America VR Content Creation Market Forecast, By Solution, 2014 – 2024 (US$ Mn)
Table 9: North America VR Content Creation Market Forecast, By End-Use Sector, 2014 – 2024 (US$ Mn)
Table 10: North America VR Content Creation Market Forecast, By Country, 2014 – 2024 (US$ Mn)
Table 11: Europe VR Content Creation Market Forecast, By Content Type, 2014 – 2024 (US$ Mn)
Table 12: Europe VR Content Creation Market Forecast, By Videos, 2014 – 2024 (US$ Mn)
Table 13: Europe VR Content Creation Market Forecast, By Solution, 2014 – 2024 (US$ Mn)
Table 14: Europe VR Content Creation Market Forecast, By End-Use Sector, 2014 – 2024 (US$ Mn)
Table 15: Europe VR Content Creation Market Forecast, By Country, 2014 – 2024 (US$ Mn)
Table 16: Asia-Pacific VR Content Creation Market Forecast, By Content Type, 2014 – 2024 (US$ Mn)
Table 17: Asia-Pacific VR Content Creation Market Forecast, By Videos, 2014 – 2024 (US$ Mn)
Table 18: Asia-Pacific VR Content Creation Market Forecast, By Solution, 2014 – 2024 (US$ Mn)
Table 19: Asia-Pacific VR Content Creation Market Forecast, By End-use Sector, 2014 – 2024 (US$ Mn)
Table 20: Asia-Pacific VR Content Creation Market Forecast, By Country, 2014 – 2024 (US$ Mn)
Table 21: MEA VR Content Creation Market Forecast, By Content Type, 2014 – 2024 (US$ Mn)
Table 22: MEA VR Content Creation Market Forecast, By Videos, 2014 – 2024 (US$ Mn)
Table 23: MEA VR Content Creation Market Forecast, By Solution, 2014 – 2024 (US$ Mn)
Table 24: MEA VR Content Creation Market Forecast, By End-use Sector, 2014 – 2024 (US$ Mn)
Table 25: MEA VR Content Creation Market Forecast, By Country, 2014 – 2024 (US$ Mn)
Table 26: South America VR Content Creation Market Forecast, By Content Type, 2014 – 2024 (US$ Mn)
Table 27: South America VR Content Creation Market Forecast, By Videos, 2014 – 2024 (US$ Mn)
Table 28: South America VR Content Creation Market Forecast, By Solution, 2014 – 2024 (US$ Mn)
Table 29: South America VR Content Creation Market Forecast, By End-use Sector, 2014 – 2024 (US$ Mn)
Table 30: South America VR Content Creation Market Forecast, By Country, 2014 – 2024 (US$ Mn)
List of Figures
Figure 1: Market Revenue Projections, 2014 - 2024 (US$ Mn)
Figure 2: Market Value Share (Revenue), By Content Type (2016)
Figure 3: Market Value Share (Revenue), By Solution (2016)
Figure 4: Market Value Share (Revenue), By End-Use Sector (2016)
Figure 5: Market Value (Revenue) Share, By Geography (2016)
Figure 6: Global VR Content Creation Market Value Share Analysis, By Content Type, 2016 and 2024
Figure 7: Global VR Content Creation Market Graph for Videos
Figure 8: Global VR Content Creation Market Graph for 360 Degree Photos
Figure 9: Global VR Content Creation Market Graph for Games
Figure 10: VR Content Creation Comparison Matrix
Figure 11: VR Content Creation Market Attractiveness Analysis, By Content Type
Figure 12: Global VR Content Creation Market Value Share Analysis, By Solution, 2016 and 2024
Figure 13: Global VR Content Creation Market Graph for Software/Application
Figure 14: Global VR Content Creation Market Graph for Services
Figure 15: VR Content Creation Comparison Matrix
Figure 16: VR Content Creation Market Attractiveness Analysis, By Solution
Figure 17: Global VR Content Creation Market Value Share Analysis, By End-Use Sector, 2016 and 2024
Figure 18: Global VR Content Creation Market Graph for Real Estate
Figure 19: Global VR Content Creation Market Graph for Travel, Hospitality and Events
Figure 20: Global VR Content Creation Market Graph for Media and Entertainment
Figure 21: Global VR Content Creation Market Graph for Retail
Figure 22: Global VR Content Creation Market Graph for Gaming
Figure 23: Global VR Content Creation Market Graph for Automotive
Figure 24: Global VR Content Creation Market Graph for Others
Figure 25: VR Content Creation Comparison Matrix
Figure 26: Global VR Content Creation Market Forecast, By End-use Sector
Figure 27: Global VR Content Creation Market Value Share Analysis, By Region, 2016 and 2024
Figure 28: VR Content Creation Market Attractiveness Analysis, By Region
Figure 29: North America VR Content Creation Market Revenue (US$ Mn) and Y-o-Y Forecast, 2016 – 2024
Figure 30: North America VR Content Creation Market Value Share Analysis, By Content Type, 2016 and 2024
Figure 31: North America VR Content Creation Market Value Share Analysis, By Solution, 2016 and 2024
Figure 32: North America VR Content Creation Market Value Share Analysis, By End-use Sector, 2016 and 2024
Figure 33: North America VR Content Creation Market Value Share Analysis, By Country, 2016 and 2024
Figure 34: North America VR Content Creation Market Attractiveness Analysis, By Content Type
Figure 35: North America VR Content Creation Market Attractiveness Analysis, By Solution
Figure 36: North America VR Content Creation Market Attractiveness Analysis, By End-Use Sector
Figure 37: North America VR Content Creation Market Attractiveness Analysis, By Country
Figure 38: Europe VR Content Creation Market Revenue (US$ Mn) and Y-o-Y Forecast, 2016 – 2024
Figure 39: Europe VR Content Creation Market Value Share Analysis, By Content Type, 2016 and 2024
Figure 40: Europe VR Content Creation Market Value Share Analysis, By Solution, 2016 and 2024
Figure 41: Europe VR Content Creation Market Value Share Analysis, By End-Use Sector, 2016 and 2024
Figure 42: Europe VR Content Creation Market Value Share Analysis, By Country, 2016 and 2024
Figure 43: Europe VR Content Creation Market Attractiveness Analysis, By Content Type
Figure 44: Europe VR Content Creation Market Attractiveness Analysis, By Solution
Figure 45: Europe VR Content Creation Market Attractiveness Analysis, By End-Use Sector
Figure 46: Europe VR Content Creation Market Attractiveness Analysis, By Country
Figure 47: Asia Pacific VR Content Creation Market Revenue (US$ Mn) and Y-o-Y Forecast, 2016 – 2024
Figure 48: Asia-Pacific VR Content Creation Market Value Share Analysis, By Content Type, 2016 and 2024
Figure 49: Asia-Pacific VR Content Creation Market Value Share Analysis, By Solution, 2016 and 2024
Figure 50: Asia-Pacific VR Content Creation Market Value Share Analysis, By End-Use Sector, 2016 and 2024
Figure 51: Asia-Pacific VR Content Creation Market Value Share Analysis, By Country, 2016 and 2024
Figure 52: Asia-Pacific VR Content Creation Market Attractiveness Analysis, By Content Type
Figure 53: Asia-Pacific VR Content Creation Market Attractiveness Analysis, By Solution
Figure 54: Asia-Pacific VR Content Creation Market Attractiveness Analysis, By End-Use Sector
Figure 55: Asia Pacific VR Content Creation Market Attractiveness Analysis, By Country
Figure 56: MEA VR Content Creation Market Revenue (US$ Mn) and Y-o-Y Forecast, 2016 – 2024
Figure 57: MEA VR Content Creation Market Value Share Analysis, By Content Type, 2016 and 2024
Figure 58: MEA VR Content Creation Market Value Share Analysis, By Solution, 2016 and 2024
Figure 59: MEA VR Content Creation Market Value Share Analysis, By End-use Sector, 2016 and 2024
Figure 60: MEA VR Content Creation Market Value Share Analysis, By Country, 2016 and 2024
Figure 61: MEA VR Content Creation Market Attractiveness Analysis, By Content Type
Figure 62: MEA VR Content Creation Market Attractiveness Analysis, By Solution
Figure 63: MEA VR Content Creation Market Attractiveness Analysis, By End-use Sector
Figure 64: MEA VR Content Creation Market Attractiveness Analysis, By Country
Figure 65: South America VR Content Creation Market Revenue (US$ Mn) and Y-o-Y Forecast, 2016 – 2024
Figure 66: South America VR Content Creation Market Value Share Analysis, By Content Type, 2016 and 2024
Figure 67: South America VR Content Creation Market Value Share Analysis, By Solution, 2016 and 2024
Figure 68: South America VR Content Creation Market Value Share Analysis, By End-Use Sector, 2016 and 2024
Figure 69: South America VR Content Creation Market Value Share Analysis, By Country, 2016 and 2024
Figure 70: South America VR Content Creation Market Attractiveness Analysis, By Content Type
Figure 71: South America VR Content Creation Market Attractiveness Analysis, By Solution
Figure 72: South America VR Content Creation Market Attractiveness Analysis, By End-use Sector
Figure 73: South America VR and AR Market Attractiveness Analysis, By Country
Figure 74: Global VR Content Creation Market Share Analysis (2015)
Copyright © Transparency Market Research, Inc. All Rights reserved
Trust Online


VR Content Creation Market