Liquid-Applied Membrane Market

Liquid-Applied Membrane Market by Type (Elastomeric, Bituminous, Cementitious), Application (Roofing, Walls, Building Structures, Roadways), Usage, End-Use Industry (Residential Construction, Commercial Construction), and Region - Global Forecast to 2029

Report Code: CH 3979 May, 2024, by marketsandmarkets.com

The global liquid-applied membrane market size is projected to reach USD 32.1 billion by 2029 from USD 24.1 billion in 2024, at a CAGR of 5.9% during the forecast period. The liquid-applied membrane market is projected to grow significantly in the coming years. Liquid applied membranes provide dependable, long-lasting durability and weather resistance, ensuring effective shielding against water infiltration, UV exposure, and other environmental elements. They are favored over conventional waterproofing techniques due to their seamless application, adaptability, and quicker installation, thereby fueling their widespread adoption in the market.

Global Liquid - Applied Membrane Market Trend
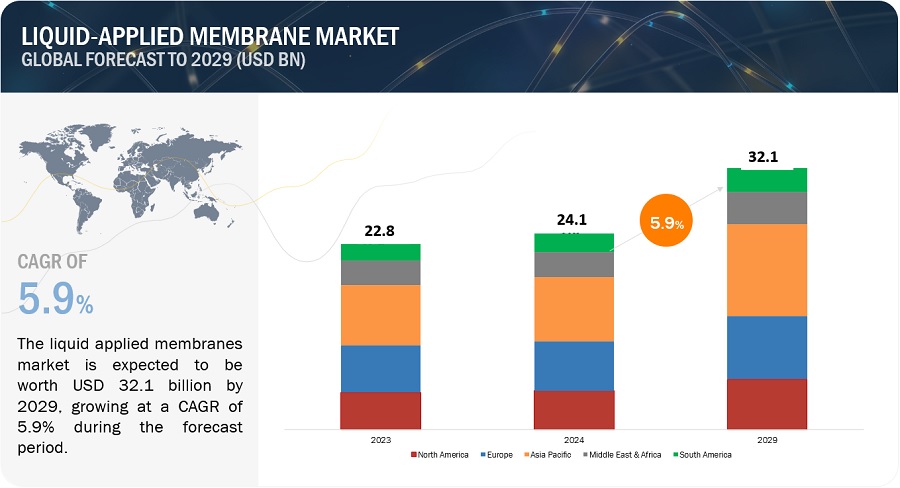
Applied Membrane Market

To know about the assumptions considered for the study, Request for Free Sample Report
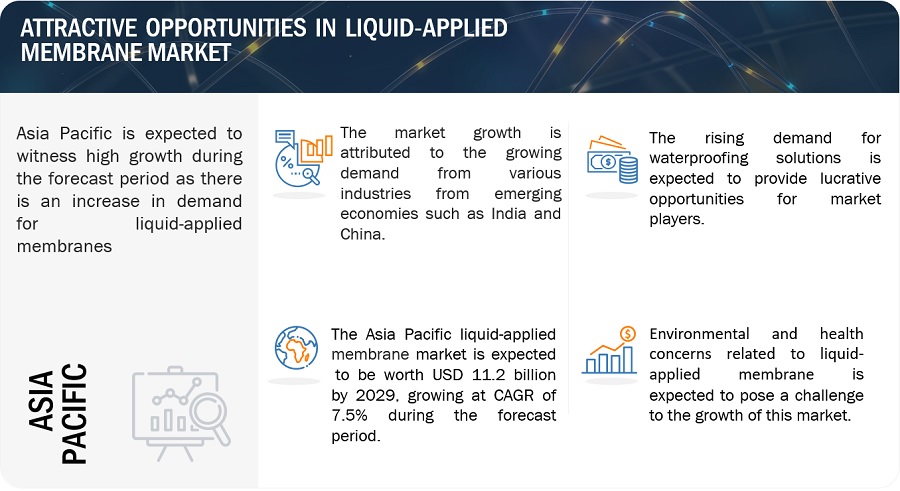
Applied Membrane Market

Liquid-applied Membrane Market Dynamics

Driver: Wide deployment of waterproofing membranes in construction sector

The growing utilization of waterproofing membranes is a central factor driving the liquid-applied membrane market. This trend reflects the increasing acknowledgment of these membranes' crucial role in maintaining the longevity and resilience of buildings in various construction contexts. Given the substantial investment involved in buildings, prioritizing their structural integrity and long-term endurance becomes essential. Waterproofing membranes serve as a proactive solution against water ingress, a leading factor contributing to structural decay, mold formation, and corrosion. Through the creation of a seamless protective layer on surfaces, liquid-applied membranes efficiently protect buildings from moisture penetration, thereby safeguarding their structural elements and prolonging their lifespan.

Restraint: High initial investment required for liquid-applied membranes

In comparison to traditional sheet membranes, the liquid-applied membrane (LAM) market has a restraint due to the significant initial investment required. LAMs often entail higher upfront costs for materials and skilled labor during the application process. This elevated expenditure can act as a deterrent for budget-conscious construction projects, particularly those on a large scale. The expenses associated with liquid-applied membranes encompass the purchase of specialized materials needed for application, such as primers, membrane coatings, and sealants, which typically command a premium compared to traditional alternatives. Moreover, the application procedure for LAMs necessitates skilled labor proficient in handling liquid coatings and ensuring thorough surface preparation, thereby escalating labor costs.

Opportunity: Growing demand for energy-efficient buildings and green roof

Increased energy expenses, evolving building regulations, and heightened awareness of urban heat island effects have generated a robust demand for energy-efficient, white, reflective roof systems. These systems reflect a substantial portion of sunlight, effectively reducing roof surface temperatures and lessening the need for air conditioning. Liquid-applied membranes, particularly elastomeric variants, find extensive use in maintaining these roof systems. Given the desire for energy-efficient roofing solutions, white acrylic elastomeric membranes are commonly applied across various substrates, including built-up and modified bitumen roof systems, while single-ply membranes are utilized to enhance roof energy efficiency.

Challenges: Environmental and health concerns present a significant challenge

Environmental and health issues pose a considerable challenge in the liquid-applied membrane (LAMs) market. LAMs commonly contain volatile organic compounds (VOCs), which may pose risks to both human health and the environment. This concern has raised alarm among stakeholders, prompting the need for more stringent regulations to address associated hazards affecting production and application practices. VOCs found in LAMs have the potential to contribute to indoor air pollution and pose health hazards to occupants of buildings where these membranes are utilized. Furthermore, emissions of VOCs can lead to adverse environmental impacts during both manufacturing and application processes, potentially contributing to air pollution and ecological harm.

Market Ecosystem
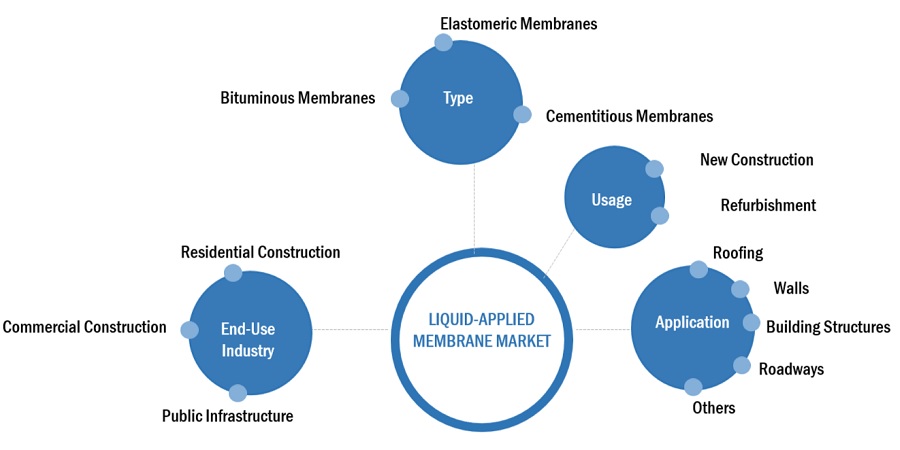
Applied Membrane Market Ecosystem

By type, Eelastomeric membranes is the fastest growing in liquid-applied membrane market, in 2023.

Elastomeric membranes are liquid-applied roofing membranes with elastic properties that enable them to expand and contract with the substrate. These membranes help to protect surfaces against water infiltration and chemical influences, providing excellent resistance to impact, UV rays, tearing, and temperature variations. Elastomeric membranes typically comprise two layers: a base membrane and a top sheet embedded with granules for enhanced defense. These membranes find widespread application on flat or low-slope roofs, furnishing a robust, lightweight, and visually appealing roofing alternative. Installation methods vary, from torch application to cold-laying techniques using self-adhesive strips.

By application, roofing is the largest in liquid-applied membrane market, in 2023.

Liquid-applied membranes(LAMs) offer a seamless and impermeable barrier that effectively blocks water penetration through the roof, safeguarding the building interiors from potential water damage. Moisture infiltration through the roof has the potential to accumulate within the building’s structure, fostering conditions conducive to rot, decay, and growth of mold and mildew. LAMs offer a dependable waterproofing defense, mitigating the likelihood of moisture-related problems and maintaining the structural integrity of the roof and the building itself. Green roofs are particularly advantageous for regions with limited land area and tropical climates. In addition, rooftop vegetation supports sustainable development goals and presents opportunities for soil-less agriculture, contributing to environmental sustainability

By end-use industry, residential construction is the largest emd-use industry in the liquid-applied membrane market, in 2023.

Residential construction projects encompass many structures, including houses, cottages, condominiums, foundations, townhouses, apartment buildings, wet rooms, driveways, sidewalks, basements, and drainage systems. LAMS are primarily employed to enhance the strength and durability of various components, such as walls, roofing, floors, foundations, beams, slabs, and pillars. They are instrumental in waterproofing all roofs, addressing residential structures' sustainability, ozone resistance, and thermal shock durability requirements. Applying LAMs in residential construction involves spreading the liquid membrane over the surface, which subsequently dries to create a seamless and waterproof layer.

Asia Pacific is the largest market in the liquid-applied membrane market, in terms of value.

In terms of value, Asia Pacific accounted for 32.3% of the global liquid-applied membrane market in 2023. It is also the fastest-growing liquid-applied membrane market due to the increasing population & urbanization in the region. The rising investments in infrastructure projects, such as commercial buildings, residential complexes, and public infrastructure, have augmented the demand for liquid-applied membranes. The ability of these membranes to provide long-lasting protection against water ingress, even in extreme weather conditions, makes them an ideal choice for a wide range of applications.
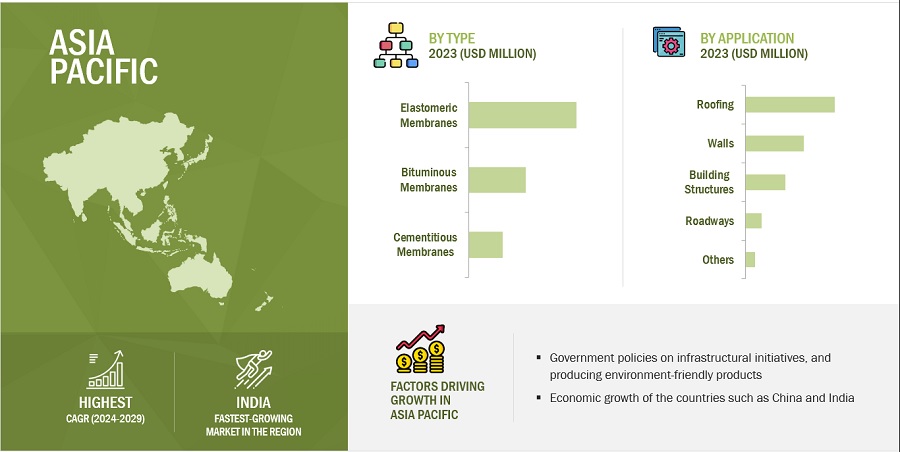
Applied Membrane Market by Region

To know about the assumptions considered for the study, download the pdf brochure

Key Market Players

Some of the key players operating in the liquid-applied membrane market include Sika AG (Switzerland), MAPEI S.p.A. (Italy), SOPREMA (France), Fosroc, Inc. (UAE), Saint-Gobain Weber (France), H.B. Fuller (US), Wacker Chemie AG (Germany), Bostik (France), GCP Applied Technologies Inc (US), and Ardex (Germany) among others.

These companies have adopted various organic as well as inorganic growth strategies between 2021 and 2023 to strengthen their positions in the market. The new product launch is the key growth strategy adopted by these leading players to enhance regional presence and develop product portfolios to meet the growing demand for liquid-applied membrane from emerging economies.

Get online access to the report on the World's First Market Intelligence Cloud

  • Easy to Download Historical Data & Forecast Numbers
  • Company Analysis Dashboard for high growth potential opportunities
  • Research Analyst Access for customization & queries
  • Competitor Analysis with Interactive dashboard
  • Latest News, Updates & Trend analysis
Request Sample

Scope of the Report

Report Metric

Details

Years considered for the study

2021-2029

Base Year

2023

Forecast period

2024–2029

Units considered

Value (USD Million), Volume (Million Square Meter)

Segments

Type, Usage, Application, End-use Industry and Region

Regions

Asia Pacific, North America, Europe, Middle East & Africa, and South America

Companies

Sika AG (Switzerland), MAPEI S.p.A. (Italy), SOPREMA (France), Fosroc, Inc. (UAE), Saint-Gobain Weber (France), H.B. Fuller (US), Wacker Chemie AG (Germany), Bostik (France), GCP Applied Technologies Inc (US), and Ardex (Germany) among others.

This report categorizes the global liquid-applied membrane market based on type, usage, application, end-use industry, and region.

On the basis of type, the liquid-applied membrane market has been segmented as follows:
  • Elastomeric Membranes
  • Bituminous Membranes
  • Cementitious Membranes
On the basis of applications, the liquid-applied membrane market has been segmented as follows: 
  • Roofing
  • Walls
  • Building Structures
  • Roadways
  • Other Applications
On the basis of end-use industry, the liquid-applied membrane market has been segmented as follows: 
  • Residential Construction
  • Commercial Construction
  • Public Infrastructure
On the basis of usage, the liquid-applied membrane market has been segmented as follows: 
  • New Construction
  • Refurbishment
On the basis of region, the liquid-applied membrane market has been segmented as follows: 
  • North America
  • Asia Pacific
  • Europe
  • South America
  • Middle East & Africa
The liquid-applied membrane market has been further analyzed based on key countries in each of these regions.

Recent Developments

  • In February 2024, MAPEI S.p.A. acquired Bitumat, a leading company in the manufacturing and marketing of waterproofing systems. This acquisition has significantly strengthened Mapei's presence in the liquid-applied membrane market. This strategic move aligns with Mapei's internationalization strategy and expands its market in the Middle East.
  • In September 2022, GCP Applied Technologies Inc. was acquired by Saint-Gobain, a leading manufacturer for the construction and industrial markets. This acquisition helped GCP Applied Technologies Inc. expand its presence in the construction chemicals sector. It also offered a broader range of construction solutions, such as liquid-applied membranes, in North America.
  • In December 2022, Sika AG inaugurates a new facility in Chongqing, Southwest China, for liquid membranes and mortar production, enhancing its presence in the burgeoning metropolitan area amid plans for the Chengdu-Chongqing business district.

Frequently Asked Questions (FAQ):

To speak to our analyst for a discussion on the above findings, click Speak to Analyst

TABLE OF CONTENTS
 
1 INTRODUCTION (Page No. - 39)
    1.1 STUDY OBJECTIVES 
    1.2 MARKET DEFINITION 
    1.3 STUDY SCOPE 
           1.3.1 MARKET SEGMENTATION
           1.3.2 INCLUSIONS & EXCLUSIONS
           1.3.3 REGIONS COVERED
           1.3.4 YEARS CONSIDERED
    1.4 CURRENCY CONSIDERED 
    1.5 UNITS CONSIDERED 
    1.6 STAKEHOLDERS 
    1.7 SUMMARY OF CHANGES 
    1.8 RECESSION IMPACT 
 
2 RESEARCH METHODOLOGY (Page No. - 44)
    2.1 RESEARCH DATA 
          FIGURE 1 LIQUID-APPLIED MEMBRANE MARKET: RESEARCH DESIGN
           2.1.1 SECONDARY DATA
                    2.1.1.1 Key data from secondary sources
           2.1.2 PRIMARY DATA
                    2.1.2.1 Key data from primary sources
                    2.1.2.2 Breakdown of primary interviews
                    2.1.2.3 Key industry insights
                    2.1.2.4 Key primary participants
    2.2 MARKET SIZE ESTIMATION 
          FIGURE 2 LIQUID-APPLIED MEMBRANE MARKET: MARKET SIZE ESTIMATION
           2.2.1 TOP-DOWN APPROACH
                    FIGURE 3 LIQUID-APPLIED MEMBRANE MARKET: TOP-DOWN APPROACH
           2.2.2 BOTTOM-UP APPROACH
                    FIGURE 4 LIQUID-APPLIED MEMBRANE MARKET: BOTTOM-UP APPROACH
    2.3 DATA TRIANGULATION 
          FIGURE 5 LIQUID-APPLIED MEMBRANE MARKET: DATA TRIANGULATION
    2.4 RESEARCH ASSUMPTIONS 
    2.5 LIMITATIONS 
    2.6 FACTOR ANALYSIS 
    2.7 GROWTH FORECAST 
           2.7.1 SUPPLY-SIDE APPROACH
           2.7.2 DEMAND-SIDE APPROACH
    2.8 RECESSION IMPACT 
 
3 EXECUTIVE SUMMARY (Page No. - 53)
    FIGURE 6 ELASTOMERIC MEMBRANES TO ACCOUNT FOR LARGEST MARKET SHARE IN 2029
    FIGURE 7 WALLS TO BE FASTEST-GROWING APPLICATION DURING FORECAST PERIOD
    FIGURE 8 RESIDENTIAL CONSTRUCTION TO LEAD MARKET DURING FORECAST PERIOD
    FIGURE 9 NEW CONSTRUCTION TO DOMINATE MARKET DURING FORECAST PERIOD
    FIGURE 10 ASIA PACIFIC TO RECORD FASTEST GROWTH DURING FORECAST PERIOD
 
4 PREMIUM INSIGHTS (Page No. - 56)
    4.1 ATTRACTIVE OPPORTUNITIES FOR PLAYERS IN LIQUID-APPLIED MEMBRANE MARKET 
          FIGURE 11 RISING DEMAND FROM CONSTRUCTION SECTOR TO DRIVE ASIA PACIFIC MARKET
    4.2 LIQUID-APPLIED MEMBRANE MARKET, BY TYPE 
          FIGURE 12 ELASTOMERIC MEMBRANES TO RECORD HIGHEST GROWTH DURING FORECAST PERIOD
    4.3 LIQUID-APPLIED MEMBRANE MARKET, BY APPLICATION 
          FIGURE 13 ROOFING APPLICATION TO LEAD MARKET IN 2029
    4.4 LIQUID-APPLIED MEMBRANE MARKET, BY END-USE INDUSTRY 
          FIGURE 14 RESIDENTIAL CONSTRUCTION TO HOLD LARGEST MARKET SHARE IN 2029
    4.5 LIQUID-APPLIED MEMBRANE MARKET, BY USAGE 
          FIGURE 15 REFURBISHMENT SEGMENT TO RECORD FASTEST-GROWTH DURING FORECAST PERIOD
    4.6 LIQUID-APPLIED MEMBRANE MARKET, BY KEY COUNTRY 
          FIGURE 16 INDIA TO REGISTER HIGHEST CAGR DURING FORECAST PERIOD
 
5 MARKET OVERVIEW (Page No. - 59)
    5.1 INTRODUCTION 
    5.2 MARKET DYNAMICS 
          FIGURE 17 MARKET DYNAMICS OF LIQUID-APPLIED MEMBRANE MARKET
           5.2.1 DRIVERS
                    5.2.1.1 High spending on infrastructure development
                                FIGURE 18 LIQUID-APPLIED MEMBRANE MARKET: WORLDWIDE CONSTRUCTION INDUSTRY SPENDING
                    5.2.1.2 Wide deployment of waterproofing membranes in construction sector
                    5.2.1.3 Stringent building codes and standards in construction projects
           5.2.2 RESTRAINTS
                    5.2.2.1 Increasing demand for sheet membranes as substitutes
                    5.2.2.2 High initial investment required for liquid-applied membranes
           5.2.3 OPPORTUNITIES
                    5.2.3.1 Growing demand for energy-efficient buildings and green roofs
           5.2.4 CHALLENGES
                    5.2.4.1 Environmental and health concerns related to liquid-applied membranes
 
6 INDUSTRY TRENDS (Page No. - 64)
    6.1 INTRODUCTION 
    6.2 VALUE CHAIN ANALYSIS 
          FIGURE 19 LIQUID-APPLIED MEMBRANE MARKET: VALUE CHAIN ANALYSIS
           6.2.1 RAW MATERIAL SOURCING
           6.2.2 MANUFACTURING
           6.2.3 DISTRIBUTION
           6.2.4 END USERS
    6.3 REGULATORY LANDSCAPE 
           6.3.1 REGULATIONS
                    6.3.1.1 North America
                    6.3.1.2 Europe
                    6.3.1.3 Asia Pacific
           6.3.2 STANDARDS
                    6.3.2.1 ISO 15824
                    6.3.2.2 ISO 19288
                    6.3.2.3 ASTM D4068
                    6.3.2.4 ASTM D6788
           6.3.3 REGULATORY BODIES, GOVERNMENT AGENCIES, & OTHER ORGANIZATIONS
                    TABLE 1 NORTH AMERICA: REGULATORY BODIES, GOVERNMENT AGENCIES, AND OTHER ORGANIZATIONS
                    TABLE 2 ASIA PACIFIC: REGULATORY BODIES, GOVERNMENT AGENCIES, AND OTHER ORGANIZATIONS
                    TABLE 3 EUROPE: REGULATORY BODIES, GOVERNMENT AGENCIES, AND OTHER ORGANIZATIONS
    6.4 TRADE ANALYSIS 
           6.4.1 IMPORT SCENARIO
                    FIGURE 20 ADHESIVE WATERPROOFING MEMBRANES, KEY COUNTRY, 2018–2022 (USD MILLION)
           6.4.2 EXPORT SCENARIO
                    FIGURE 21 ADHESIVE WATERPROOFING MEMBRANES, KEY COUNTRY, 2018–2022 (USD MILLION)
    6.5 MACROECONOMIC INDICATORS 
           6.5.1 GLOBAL GDP TRENDS
                    TABLE 4 TRENDS PER CAPITA GDP, 2020–2023 (USD)
                    TABLE 5 GDP GROWTH ESTIMATE AND PROJECTION OF KEY COUNTRIES, 2024–2027
                    TABLE 6 INDUSTRY (INCLUDING CONSTRUCTION) VALUE-ADDED STATISTICS, BY COUNTRY, 2023 (USD MILLION)
    6.6 PRICING ANALYSIS 
           6.6.1 AVERAGE SELLING PRICE TREND, BY REGION
                    FIGURE 22 AVERAGE SELLING PRICE TREND, BY REGION (USD/SQUARE METER)
           6.6.2 AVERAGE SELLING PRICE TREND, BY END-USE INDUSTRY
                    FIGURE 23 AVERAGE SELLING PRICE TREND, BY END-USE INDUSTRY (USD/SQUARE METER)
           6.6.3 AVERAGE SELLING PRICE TREND OF KEY PLAYERS, BY END-USE INDUSTRY
                    FIGURE 24 AVERAGE SELLING PRICE TREND, BY KEY MARKET PLAYERS (USD/SQUARE METER)
    6.7 INVESTMENT AND FUNDING SCENARIO 
          FIGURE 25 INVESTMENT AND FUNDING SCENARIO, 2019–2023 (USD MILLION)
    6.8 ECOSYSTEM 
          FIGURE 26 LIQUID-APPLIED MEMBRANE MARKET: ECOSYSTEM
          TABLE 7 ROLE IN ECOSYSTEM: LIQUID-APPLIED MEMBRANE MARKET
    6.9 TRENDS/DISRUPTIONS IMPACTING CUSTOMER BUSINESS 
          FIGURE 27 TRENDS IN LIQUID-APPLIED MEMBRANE MARKET
    6.10 TECHNOLOGY ANALYSIS 
           6.10.1 KEY TECHNOLOGY
                    6.10.1.1 New formulations
           6.10.2 COMPLEMENTARY TECHNOLOGY
                    6.10.2.1 Spray application technique
    6.11 RAW MATERIAL ANALYSIS 
           6.11.1 BITUMINOUS MEMBRANES
           6.11.2 ELASTOMERIC MEMBRANES
                    6.11.2.1 Acrylic
                    6.11.2.2 Polyurethane
           6.11.3 CEMENTITIOUS MEMBRANES
    6.12 PORTER’S FIVE FORCES ANALYSIS 
           FIGURE 28 PORTER’S FIVE FORCES ANALYSIS OF LIQUID-APPLIED MEMBRANE MARKET
           6.12.1 THREAT OF NEW ENTRANTS
           6.12.2 THREAT OF SUBSTITUTES
           6.12.3 BARGAINING POWER OF SUPPLIERS
           6.12.4 BARGAINING POWER OF BUYERS
           6.12.5 INTENSITY OF COMPETITIVE RIVALRY
                     TABLE 8 LIQUID-APPLIED MEMBRANE MARKET: PORTER’S FIVE FORCES ANALYSIS
    6.13 CASE STUDY ANALYSIS 
           6.13.1 AIR GUARD VPA COATING ENHANCES ASPHALT’S FLEXIBILITY AND DURABILITY
           6.13.2 SIKALASTIC ROOFPRO MEMBRANE SYSTEM PROVIDES FULLY REINFORCED MEMBRANE
           6.13.3 FOSROC NITOPROOF 600PF PROVIDES EFFECTIVE WATERPROOFING
    6.14 KEY CONFERENCES & EVENTS IN 2024–2025 
            TABLE 9 LIQUID-APPLIED MEMBRANE MARKET: KEY CONFERENCES & EVENTS, 2024–2025
    6.15 PATENT ANALYSIS 
           6.15.1 METHODOLOGY
           6.15.2 DOCUMENT TYPES
                     FIGURE 29 LIQUID-APPLIED MEMBRANE MARKET: GRANTED PATENTS
           6.15.3 PUBLICATION TRENDS IN LAST 12 YEARS
                     FIGURE 30 NUMBER OF PATENTS YEAR-WISE FROM 2012 TO 2023
           6.15.4 INSIGHTS
           6.15.5 LEGAL STATUS OF PATENTS
           6.15.6 JURISDICTION ANALYSIS
                     FIGURE 31 TOP JURISDICTION, BY DOCUMENT
           6.15.7 TOP APPLICANTS
                     FIGURE 32 TOP 10 PATENT APPLICANTS
                     TABLE 10 LIST OF PATENTS BY SIKA AG
                     TABLE 11 LIST OF PATENTS BY BASF SE
                     TABLE 12 LIST OF PATENTS BY MICROJET TECHNOLOGY CO., LTD.
                     TABLE 13 TOP 20 PATENT OWNERS DURING LAST TWELVE YEARS
    6.16 KEY STAKEHOLDERS AND BUYING CRITERIA 
           6.16.1 KEY STAKEHOLDERS IN BUYING PROCESS
                     FIGURE 33 INFLUENCE OF STAKEHOLDERS ON BUYING PROCESS FOR TOP 3 APPLICATIONS
                     TABLE 14 INFLUENCE OF STAKEHOLDERS ON BUYING PROCESS FOR TOP 3 APPLICATIONS (%)
           6.16.2 BUYING CRITERIA
                     FIGURE 34 KEY BUYING CRITERIA FOR TOP 3 APPLICATIONS
                     TABLE 15 KEY BUYING CRITERIA FOR TOP 3 APPLICATIONS
 
7 LIQUID-APPLIED MEMBRANE MARKET, BY APPLICATION (Page No. - 89)
    7.1 INTRODUCTION 
          FIGURE 35 WALLS APPLICATION TO RECORD FASTEST GROWTH DURING FORECAST PERIOD
          TABLE 16 LIQUID-APPLIED MEMBRANE MARKET, BY APPLICATION, 2021–2023 (USD MILLION)
          TABLE 17 LIQUID-APPLIED MEMBRANE MARKET, BY APPLICATION, 2024–2029 (USD MILLION)
          TABLE 18 LIQUID-APPLIED MEMBRANE MARKET, BY APPLICATION, 2021–2023 (MILLION SQUARE METER)
          TABLE 19 LIQUID-APPLIED MEMBRANE MARKET, BY APPLICATION, 2024–2029 (MILLION SQUARE METER)
    7.2 ROOFING 
           7.2.1 RISING DEMAND FOR GREEN ROOF SYSTEMS TO DRIVE MARKET
    7.3 WALLS 
           7.3.1 PRESSING NEED TO PREVENT INFILTRATION IN BUILDINGS TO DRIVE DEMAND FOR GREEN WALLS
    7.4 BUILDING STRUCTURES 
           7.4.1 STRUCTURAL CRACKING AND BIOLOGICAL DEGRADATION TO FUEL DEMAND FOR POLYURETHANE AND BITUMINOUS MEMBRANES
    7.5 ROADWAYS 
           7.5.1 RISING INFRASTRUCTURE PROJECTS TO FUEL MARKET
    7.6 OTHER APPLICATIONS 
 
8 LIQUID-APPLIED MEMBRANE MARKET, BY END-USE INDUSTRY (Page No. - 94)
    8.1 INTRODUCTION 
          FIGURE 36 RESIDENTIAL CONSTRUCTION INDUSTRY TO DOMINATE MARKET DURING FORECAST PERIOD
          TABLE 20 LIQUID-APPLIED MEMBRANE MARKET, BY END-USE INDUSTRY, 2021–2023 (USD MILLION)
          TABLE 21 LIQUID-APPLIED MEMBRANE MARKET, BY END-USE INDUSTRY, 2024–2029 (USD MILLION)
          TABLE 22 LIQUID-APPLIED MEMBRANE MARKET, BY END-USE INDUSTRY, 2021–2023 (MILLION SQUARE METER)
          TABLE 23 LIQUID-APPLIED MEMBRANE MARKET, BY END-USE INDUSTRY, 2024–2029 (MILLION SQUARE METER)
    8.2 RESIDENTIAL CONSTRUCTION 
           8.2.1 DURABILITY AND RESISTANCE TO THERMAL SHOCKS TO FUEL DEMAND
    8.3 COMMERCIAL CONSTRUCTION 
           8.3.1 INCREASING DEMAND FOR COMMERCIAL INFRASTRUCTURE TO BOOST MARKET
    8.4 PUBLIC INFRASTRUCTURE 
           8.4.1 RAPID URBANIZATION AND INDUSTRIALIZATION TO DRIVE MARKET
 
9 LIQUID-APPLIED MEMBRANE MARKET, BY TYPE (Page No. - 98)
    9.1 INTRODUCTION 
          FIGURE 37 ELASTOMERIC MEMBRANES TO BE LARGEST TYPE DURING FORECAST PERIOD
          TABLE 24 LIQUID-APPLIED MEMBRANE MARKET, BY TYPE, 2021–2023 (USD MILLION)
          TABLE 25 LIQUID-APPLIED MEMBRANE MARKET, BY TYPE, 2024–2029 (USD MILLION)
          TABLE 26 LIQUID-APPLIED MEMBRANE MARKET, BY TYPE, 2021–2023 (MILLION SQUARE METER)
          TABLE 27 LIQUID-APPLIED MEMBRANE MARKET, BY TYPE, 2024–2029 (MILLION SQUARE METER)
    9.2 ELASTOMERIC MEMBRANES 
           9.2.1 NEED FOR MEMBRANES WITH ROBUST PERFORMANCE IN SENSITIVE ENVIRONMENTS TO DRIVE MARKET
           9.2.2 ACRYLIC MEMBRANES
           9.2.3 POLYURETHANE WATERPROOFING MEMBRANES
           9.2.4 PMMA MEMBRANES
    9.3 BITUMINOUS MEMBRANES 
           9.3.1 RESISTANCE TO UV AND TEMPERATURE FLUCTUATIONS TO DRIVE DEMAND
           9.3.2 SOLVENT–BASED
           9.3.3 WATER–BASED
    9.4 CEMENTITIOUS MEMBRANES 
           9.4.1 WIDE APPLICATIONS IN ROOFS AND TUNNELS TO DRIVE MARKET
           9.4.2 ONE-COMPONENT (1K)
           9.4.3 TWO-COMPONENT (2K)
 
10 LIQUID-APPLIED MEMBRANE MARKET, BY USAGE (Page No. - 105)
     10.1 INTRODUCTION 
             FIGURE 38 NEW CONSTRUCTION SEGMENT TO DOMINATE MARKET DURING FORECAST PERIOD
             TABLE 28 LIQUID-APPLIED MEMBRANE MARKET, BY USAGE, 2021–2023 (USD MILLION)
             TABLE 29 LIQUID-APPLIED MEMBRANE MARKET, BY USAGE, 2024–2029 (USD MILLION)
             TABLE 30 LIQUID-APPLIED MEMBRANE MARKET, BY USAGE, 2021–2023 (MILLION SQUARE METER)
             TABLE 31 LIQUID-APPLIED MEMBRANE MARKET, BY USAGE, 2024–2029 (MILLION SQUARE METER)
     10.2 NEW CONSTRUCTION 
             10.2.1 VERSATILITY AND COST-EFFECTIVENESS OF MEMBRANES TO DRIVE MARKET
     10.3 REFURBISHMENT 
             10.3.1 RISE IN INFRASTRUCTURAL DEVELOPMENTS TO BOOST MARKET
 
11 LIQUID-APPLIED MEMBRANE MARKET, BY REGION (Page No. - 109)
     11.1 INTRODUCTION 
             FIGURE 39 INDIA TO BE FASTEST-GROWING MARKET DURING FORECAST PERIOD
             TABLE 32 LIQUID-APPLIED MEMBRANE MARKET, BY REGION, 2021–2023 (USD MILLION)
             TABLE 33 LIQUID-APPLIED MEMBRANE MARKET, BY REGION, 2024–2029 (USD MILLION)
             TABLE 34 LIQUID-APPLIED MEMBRANE MARKET, BY REGION, 2021–2023 (MILLION SQUARE METER)
             TABLE 35 LIQUID-APPLIED MEMBRANE MARKET, BY REGION, 2024–2029 (MILLION SQUARE METER)
     11.2 NORTH AMERICA 
             11.2.1 IMPACT OF RECESSION
                        FIGURE 40 NORTH AMERICA: LIQUID-APPLIED MEMBRANE MARKET SNAPSHOT
                        TABLE 36 NORTH AMERICA: LIQUID-APPLIED MEMBRANE MARKET, BY COUNTRY, 2021–2023 (USD MILLION)
                        TABLE 37 NORTH AMERICA: LIQUID-APPLIED MEMBRANE MARKET, BY COUNTRY, 2024–2029 (USD MILLION)
                        TABLE 38 NORTH AMERICA: LIQUID-APPLIED MEMBRANE MARKET, BY COUNTRY, 2021–2023 (MILLION SQUARE METER)
                        TABLE 39 NORTH AMERICA: LIQUID-APPLIED MEMBRANE MARKET, BY COUNTRY, 2024–2029 (MILLION SQUARE METER)
                        TABLE 40 NORTH AMERICA: LIQUID-APPLIED MEMBRANE MARKET, BY END-USE INDUSTRY, 2021–2023 (USD MILLION)
                        TABLE 41 NORTH AMERICA: LIQUID-APPLIED MEMBRANE MARKET, BY END-USE INDUSTRY, 2024–2029 (USD MILLION)
                        TABLE 42 NORTH AMERICA: LIQUID-APPLIED MEMBRANE MARKET, BY END-USE INDUSTRY, 2021–2023 (MILLION SQUARE METER)
                        TABLE 43 NORTH AMERICA: LIQUID-APPLIED MEMBRANE MARKET, BY END-USE INDUSTRY, 2024–2029 (MILLION SQUARE METER)
                        TABLE 44 NORTH AMERICA: LIQUID-APPLIED MEMBRANE MARKET, BY APPLICATION, 2021–2023 (USD MILLION)
                        TABLE 45 NORTH AMERICA: LIQUID-APPLIED MEMBRANE MARKET, BY APPLICATION, 2024–2029 (USD MILLION)
                        TABLE 46 NORTH AMERICA: LIQUID-APPLIED MEMBRANE MARKET, BY APPLICATION, 2021–2023 (MILLION SQUARE METER)
                        TABLE 47 NORTH AMERICA: LIQUID-APPLIED MEMBRANE MARKET, BY APPLICATION, 2024–2029 (MILLION SQUARE METER)
                        TABLE 48 NORTH AMERICA: LIQUID-APPLIED MEMBRANE MARKET, BY TYPE, 2021–2023 (USD MILLION)
                        TABLE 49 NORTH AMERICA: LIQUID-APPLIED MEMBRANE MARKET, BY TYPE, 2024–2029 (USD MILLION)
                        TABLE 50 NORTH AMERICA: LIQUID-APPLIED MEMBRANE MARKET, BY TYPE, 2021–2023 (MILLION SQUARE METER)
                        TABLE 51 NORTH AMERICA: LIQUID-APPLIED MEMBRANE MARKET, BY TYPE, 2024–2029 (MILLION SQUARE METER)
             11.2.2 US
                        11.2.2.1 Technological advancements in infrastructure projects to drive market
                                      TABLE 52 US: LIQUID-APPLIED MEMBRANE MARKET, BY END-USE INDUSTRY, 2021–2023 (USD MILLION)
                                      TABLE 53 US: LIQUID-APPLIED MEMBRANE MARKET, BY END-USE INDUSTRY, 2024–2029 (USD MILLION)
                                      TABLE 54 US: LIQUID-APPLIED MEMBRANE MARKET, BY END-USE INDUSTRY, 2021–2023 (MILLION SQUARE METER)
                                      TABLE 55 US: LIQUID-APPLIED MEMBRANE MARKET, BY END-USE INDUSTRY, 2024–2029 (MILLION SQUARE METER)
             11.2.3 CANADA
                        11.2.3.1 Rapid construction of skyscrapers and commercial hubs to drive market
                                      TABLE 56 CANADA: LIQUID-APPLIED MEMBRANE MARKET, BY END-USE INDUSTRY, 2021–2023 (USD MILLION)
                                      TABLE 57 CANADA: LIQUID-APPLIED MEMBRANE MARKET, BY END-USE INDUSTRY, 2024–2029 (USD MILLION)
                                      TABLE 58 CANADA: LIQUID-APPLIED MEMBRANE MARKET, BY END-USE INDUSTRY, 2021–2023 (MILLION SQUARE METER)
                                      TABLE 59 CANADA: LIQUID-APPLIED MEMBRANE MARKET, BY END-USE INDUSTRY, 2024–2029 (MILLION SQUARE METER)
             11.2.4 MEXICO
                        11.2.4.1 Increased public and private investments in infrastructure projects to drive market
                                      TABLE 60 MEXICO: LIQUID-APPLIED MEMBRANE MARKET, BY END-USE INDUSTRY, 2021–2023 (USD MILLION)
                                      TABLE 61 MEXICO: LIQUID-APPLIED MEMBRANE MARKET, BY END-USE INDUSTRY, 2024–2029 (USD MILLION)
                                      TABLE 62 MEXICO: LIQUID-APPLIED MEMBRANE MARKET, BY END-USE INDUSTRY, 2021–2023 (MILLION SQUARE METER)
                                      TABLE 63 MEXICO: LIQUID-APPLIED MEMBRANE MARKET, BY END-USE INDUSTRY, 2024–2029 (MILLION SQUARE METER)
     11.3 EUROPE 
             11.3.1 IMPACT OF RECESSION
                        TABLE 64 EUROPE: LIQUID-APPLIED MEMBRANE MARKET, BY COUNTRY, 2021–2023 (USD MILLION)
                        TABLE 65 EUROPE: LIQUID-APPLIED MEMBRANE MARKET, BY COUNTRY, 2024–2029 (USD MILLION)
                        TABLE 66 EUROPE: LIQUID-APPLIED MEMBRANE MARKET, BY COUNTRY, 2021–2023 (MILLION SQUARE METER)
                        TABLE 67 EUROPE: LIQUID-APPLIED MEMBRANE MARKET, BY COUNTRY, 2024–2029 (MILLION SQUARE METER)
                        TABLE 68 EUROPE: LIQUID-APPLIED MEMBRANE MARKET, BY END-USE INDUSTRY, 2021–2023 (USD MILLION)
                        TABLE 69 EUROPE: LIQUID-APPLIED MEMBRANE MARKET, BY END-USE INDUSTRY, 2024–2029 (USD MILLION)
                        TABLE 70 EUROPE: LIQUID-APPLIED MEMBRANE MARKET, BY END-USE INDUSTRY, 2021–2023 (MILLION SQUARE METER)
                        TABLE 71 EUROPE: LIQUID-APPLIED MEMBRANE MARKET, BY END-USE INDUSTRY, 2024–2029 (MILLION SQUARE METER)
                        TABLE 72 EUROPE: LIQUID-APPLIED MEMBRANE MARKET, BY APPLICATION, 2021–2023 (USD MILLION)
                        TABLE 73 EUROPE: LIQUID-APPLIED MEMBRANE MARKET, BY APPLICATION, 2024–2029 (USD MILLION)
                        TABLE 74 EUROPE: LIQUID-APPLIED MEMBRANE MARKET, BY APPLICATION, 2021–2023 (MILLION SQUARE METER)
                        TABLE 75 EUROPE: LIQUID-APPLIED MEMBRANE MARKET, BY APPLICATION, 2024–2029 (MILLION SQUARE METER)
                        TABLE 76 EUROPE: LIQUID-APPLIED MEMBRANE MARKET, BY TYPE, 2021–2023 (USD MILLION)
                        TABLE 77 EUROPE: LIQUID-APPLIED MEMBRANE MARKET, BY TYPE, 2024–2029 (USD MILLION)
                        TABLE 78 EUROPE: LIQUID-APPLIED MEMBRANE MARKET, BY TYPE, 2021–2023 (MILLION SQUARE METER)
                        TABLE 79 EUROPE: LIQUID-APPLIED MEMBRANE MARKET, BY TYPE, 2024–2029 (MILLION SQUARE METER)
             11.3.2 GERMANY
                        11.3.2.1 Steady economic growth and rapid urbanization to boost market
                                      TABLE 80 GERMANY: LIQUID-APPLIED MEMBRANE MARKET, BY END-USE INDUSTRY, 2021–2023 (USD MILLION)
                                      TABLE 81 GERMANY: LIQUID-APPLIED MEMBRANE MARKET, BY END-USE INDUSTRY, 2024–2029 (USD MILLION)
                                      TABLE 82 GERMANY: LIQUID-APPLIED MEMBRANE MARKET, BY END-USE INDUSTRY, 2021–2023 (MILLION SQUARE METER)
                                      TABLE 83 GERMANY: LIQUID-APPLIED MEMBRANE MARKET, BY END-USE INDUSTRY, 2024–2029 (MILLION SQUARE METER)
             11.3.3 FRANCE
                        11.3.3.1 Investments in public infrastructure and digitalization to boost market
                                      TABLE 84 FRANCE: LIQUID-APPLIED MEMBRANE MARKET, BY END-USE INDUSTRY, 2021–2023 (USD MILLION)
                                      TABLE 85 FRANCE: LIQUID-APPLIED MEMBRANE MARKET, BY END-USE INDUSTRY, 2024–2029 (USD MILLION)
                                      TABLE 86 FRANCE: LIQUID-APPLIED MEMBRANE MARKET, BY END-USE INDUSTRY, 2021–2023 (MILLION SQUARE METER)
                                      TABLE 87 FRANCE: LIQUID-APPLIED MEMBRANE MARKET, BY END-USE INDUSTRY, 2024–2029 (MILLION SQUARE METER)
             11.3.4 SPAIN
                        11.3.4.1 Growth of construction industry to propel market
                                      TABLE 88 SPAIN: LIQUID-APPLIED MEMBRANE MARKET, BY END-USE INDUSTRY, 2021–2023 (USD MILLION)
                                      TABLE 89 SPAIN: LIQUID-APPLIED MEMBRANE MARKET, BY END-USE INDUSTRY, 2024–2029 (USD MILLION)
                                      TABLE 90 SPAIN: LIQUID-APPLIED MEMBRANE MARKET, BY END-USE INDUSTRY, 2021–2023 (MILLION SQUARE METER)
                                      TABLE 91 SPAIN: LIQUID-APPLIED MEMBRANE MARKET, BY END-USE INDUSTRY, 2024–2029 (MILLION SQUARE METER)
             11.3.5 UK
                        11.3.5.1 New reformed policies and rise in export activities to drive market
                                      TABLE 92 UK: LIQUID-APPLIED MEMBRANE MARKET, BY END-USE INDUSTRY, 2021–2023 (USD MILLION)
                                      TABLE 93 UK: LIQUID-APPLIED MEMBRANE MARKET, BY END-USE INDUSTRY, 2024–2029 (USD MILLION)
                                      TABLE 94 UK: LIQUID-APPLIED MEMBRANE MARKET, BY END-USE INDUSTRY, 2021–2023 (MILLION SQUARE METER)
                                      TABLE 95 UK: LIQUID-APPLIED MEMBRANE MARKET, BY END-USE INDUSTRY, 2024–2029 (MILLION SQUARE METER)
             11.3.6 ITALY
                        11.3.6.1 Rise in renovation and refurbishment projects to boost market
                                      TABLE 96 ITALY: LIQUID-APPLIED MEMBRANE MARKET, BY END-USE INDUSTRY, 2021–2023 (USD MILLION)
                                      TABLE 97 ITALY: LIQUID-APPLIED MEMBRANE MARKET, BY END-USE INDUSTRY, 2024–2029 (USD MILLION)
                                      TABLE 98 ITALY: LIQUID-APPLIED MEMBRANE MARKET, BY END-USE INDUSTRY, 2021–2023 (MILLION SQUARE METER)
                                      TABLE 99 ITALY: LIQUID-APPLIED MEMBRANE MARKET, BY END-USE INDUSTRY, 2024–2029 (MILLION SQUARE METER)
             11.3.7 RUSSIA
                        11.3.7.1 Increase in residential construction activities to fuel market
                                      TABLE 100 RUSSIA: LIQUID-APPLIED MEMBRANE MARKET, BY END-USE INDUSTRY, 2021–2023 (USD MILLION)
                                      TABLE 101 RUSSIA: LIQUID-APPLIED MEMBRANE MARKET, BY END-USE INDUSTRY, 2024–2029 (USD MILLION)
                                      TABLE 102 RUSSIA: LIQUID-APPLIED MEMBRANE MARKET, BY END-USE INDUSTRY, 2021–2023 (MILLION SQUARE METER)
                                      TABLE 103 RUSSIA: LIQUID-APPLIED MEMBRANE MARKET, BY END-USE INDUSTRY, 2024–2029 (MILLION SQUARE METER)
             11.3.8 REST OF EUROPE
                        TABLE 104 REST OF EUROPE: LIQUID-APPLIED MEMBRANE MARKET, BY END-USE INDUSTRY, 2021–2023 (USD MILLION)
                        TABLE 105 REST OF EUROPE: LIQUID-APPLIED MEMBRANE MARKET, BY END-USE INDUSTRY, 2024–2029 (USD MILLION)
                        TABLE 106 REST OF EUROPE: LIQUID-APPLIED MEMBRANE MARKET, BY END-USE INDUSTRY, 2021–2023 (MILLION SQUARE METER)
                        TABLE 107 REST OF EUROPE: LIQUID-APPLIED MEMBRANE MARKET, BY END-USE INDUSTRY, 2024–2029 (MILLION SQUARE METER)
     11.4 ASIA PACIFIC 
             11.4.1 IMPACT OF RECESSION
                        FIGURE 41 ASIA PACIFIC: LIQUID-APPLIED MEMBRANE MARKET SNAPSHOT
                        TABLE 108 ASIA PACIFIC: LIQUID-APPLIED MEMBRANE MARKET, BY COUNTRY, 2021–2023 (USD MILLION)
                        TABLE 109 ASIA PACIFIC: LIQUID-APPLIED MEMBRANE MARKET, BY COUNTRY, 2024–2029 (USD MILLION)
                        TABLE 110 ASIA PACIFIC: LIQUID-APPLIED MEMBRANE MARKET, BY COUNTRY, 2021–2023 (MILLION SQUARE METER)
                        TABLE 111 ASIA PACIFIC: LIQUID-APPLIED MEMBRANE MARKET, BY COUNTRY, 2024–2029 (MILLION SQUARE METER)
                        TABLE 112 ASIA PACIFIC: LIQUID-APPLIED MEMBRANE MARKET, BY END-USE INDUSTRY, 2021–2023 (USD MILLION)
                        TABLE 113 ASIA PACIFIC: LIQUID-APPLIED MEMBRANE MARKET, BY END-USE INDUSTRY, 2024–2029 (USD MILLION)
                        TABLE 114 ASIA PACIFIC: LIQUID-APPLIED MEMBRANE MARKET, BY END-USE INDUSTRY, 2021–2023 (MILLION SQUARE METER)
                        TABLE 115 ASIA PACIFIC: LIQUID-APPLIED MEMBRANE MARKET, BY END-USE INDUSTRY, 2024–2029 (MILLION SQUARE METER)
                        TABLE 116 ASIA PACIFIC: LIQUID-APPLIED MEMBRANE MARKET, BY APPLICATION, 2021–2023 (USD MILLION)
                        TABLE 117 ASIA PACIFIC: LIQUID-APPLIED MEMBRANE MARKET, BY APPLICATION, 2024–2029 (USD MILLION)
                        TABLE 118 ASIA PACIFIC: LIQUID-APPLIED MEMBRANE MARKET, BY APPLICATION, 2021–2023 (MILLION SQUARE METER)
                        TABLE 119 ASIA PACIFIC: LIQUID-APPLIED MEMBRANE MARKET, BY APPLICATION, 2024–2029 (MILLION SQUARE METER)
                        TABLE 120 ASIA PACIFIC: LIQUID-APPLIED MEMBRANE MARKET, BY TYPE, 2021–2023 (USD MILLION)
                        TABLE 121 ASIA PACIFIC: LIQUID-APPLIED MEMBRANE MARKET, BY TYPE, 2024–2029 (USD MILLION)
                        TABLE 122 ASIA PACIFIC: LIQUID-APPLIED MEMBRANE MARKET, BY TYPE, 2021–2023 (MILLION SQUARE METER)
                        TABLE 123 ASIA PACIFIC: LIQUID-APPLIED MEMBRANE MARKET, BY TYPE, 2024–2029 (MILLION SQUARE METER)
             11.4.2 CHINA
                        11.4.2.1 Surge in transportation projects to drive market
                                      TABLE 124 CHINA: LIQUID-APPLIED MEMBRANE MARKET, BY END-USE INDUSTRY, 2021–2023 (USD MILLION)
                                      TABLE 125 CHINA: LIQUID-APPLIED MEMBRANE MARKET, BY END-USE INDUSTRY, 2024–2029 (USD MILLION)
                                      TABLE 126 CHINA: LIQUID-APPLIED MEMBRANE MARKET, BY END-USE INDUSTRY, 2021–2023 (MILLION SQUARE METER)
                                      TABLE 127 CHINA: LIQUID-APPLIED MEMBRANE MARKET, BY END-USE INDUSTRY, 2024–2029 (MILLION SQUARE METER)
             11.4.3 INDIA
                        11.4.3.1 Government initiatives and increased infrastructure spending to drive market
                                      TABLE 128 INDIA: LIQUID-APPLIED MEMBRANE MARKET, BY END-USE INDUSTRY, 2021–2023 (USD MILLION)
                                      TABLE 129 INDIA: LIQUID-APPLIED MEMBRANE MARKET, BY END-USE INDUSTRY, 2024–2029 (USD MILLION)
                                      TABLE 130 INDIA: LIQUID-APPLIED MEMBRANE MARKET, BY END-USE INDUSTRY, 2021–2023 (MILLION SQUARE METER)
                                      TABLE 131 INDIA: LIQUID-APPLIED MEMBRANE MARKET, BY END-USE INDUSTRY, 2024–2029 (MILLION SQUARE METER)
             11.4.4 JAPAN
                        11.4.4.1 Surge in redevelopment activities to boost market
                                      TABLE 132 JAPAN: LIQUID-APPLIED MEMBRANE MARKET, BY END-USE INDUSTRY, 2021–2023 (USD MILLION)
                                      TABLE 133 JAPAN: LIQUID-APPLIED MEMBRANE MARKET, BY END-USE INDUSTRY, 2024–2029 (USD MILLION)
                                      TABLE 134 JAPAN: LIQUID-APPLIED MEMBRANE MARKET, BY END-USE INDUSTRY, 2021–2023 (MILLION SQUARE METER)
                                      TABLE 135 JAPAN: LIQUID-APPLIED MEMBRANE MARKET, BY END-USE INDUSTRY, 2024–2029 (MILLION SQUARE METER)
             11.4.5 SOUTH KOREA
                        11.4.5.1 Government investments in upgrading infrastructure to fuel market
                                      TABLE 136 SOUTH KOREA: LIQUID-APPLIED MEMBRANE MARKET, BY END-USE INDUSTRY, 2021–2023 (USD MILLION)
                                      TABLE 137 SOUTH KOREA: LIQUID-APPLIED MEMBRANE MARKET, BY END-USE INDUSTRY, 2024–2029 (USD MILLION)
                                      TABLE 138 SOUTH KOREA: LIQUID-APPLIED MEMBRANE MARKET, BY END-USE INDUSTRY, 2021–2023 (MILLION SQUARE METER)
                                      TABLE 139 SOUTH KOREA: LIQUID-APPLIED MEMBRANE MARKET, BY END-USE INDUSTRY, 2024–2029 (MILLION SQUARE METER)
             11.4.6 AUSTRALIA
                        11.4.6.1 Rising need for durable waterproofing solutions to boost market
                                      TABLE 140 AUSTRALIA: LIQUID-APPLIED MEMBRANE MARKET, BY END-USE INDUSTRY, 2021–2023 (USD MILLION)
                                      TABLE 141 AUSTRALIA: LIQUID-APPLIED MEMBRANE MARKET, BY END-USE INDUSTRY, 2024–2029 (USD MILLION)
                                      TABLE 142 AUSTRALIA: LIQUID-APPLIED MEMBRANE MARKET, BY END-USE INDUSTRY, 2021–2023 (MILLION SQUARE METER)
                                      TABLE 143 AUSTRALIA: LIQUID-APPLIED MEMBRANE MARKET, BY END-USE INDUSTRY, 2024–2029 (MILLION SQUARE METER)
             11.4.7 THAILAND
                        11.4.7.1 Growth of real estate and tourism industry to drive market
                                      TABLE 144 THAILAND: LIQUID-APPLIED MEMBRANE MARKET, BY END-USE INDUSTRY, 2021–2023 (USD MILLION)
                                      TABLE 145 THAILAND: LIQUID-APPLIED MEMBRANE MARKET, BY END-USE INDUSTRY, 2024–2029 (USD MILLION)
                                      TABLE 146 THAILAND: LIQUID-APPLIED MEMBRANE MARKET, BY END-USE INDUSTRY, 2021–2023 (MILLION SQUARE METER)
                                      TABLE 147 THAILAND: LIQUID-APPLIED MEMBRANE MARKET, BY END-USE INDUSTRY, 2024–2029 (MILLION SQUARE METER)
             11.4.8 INDONESIA
                        11.4.8.1 Rapid urbanization and population growth to drive market
                                      TABLE 148 INDONESIA: LIQUID-APPLIED MEMBRANE MARKET, BY END-USE INDUSTRY, 2021–2023 (USD MILLION)
                                      TABLE 149 INDONESIA: LIQUID-APPLIED MEMBRANE MARKET, BY END-USE INDUSTRY, 2024–2029 (USD MILLION)
                                      TABLE 150 INDONESIA: LIQUID-APPLIED MEMBRANE MARKET, BY END-USE INDUSTRY, 2021–2023 (MILLION SQUARE METER)
                                      TABLE 151 INDONESIA: LIQUID-APPLIED MEMBRANE MARKET, BY END-USE INDUSTRY, 2024–2029 (MILLION SQUARE METER)
             11.4.9 REST OF ASIA PACIFIC
                        TABLE 152 REST OF ASIA PACIFIC: LIQUID-APPLIED MEMBRANE MARKET, BY END-USE INDUSTRY, 2021–2023 (USD MILLION)
                        TABLE 153 REST OF ASIA PACIFIC: LIQUID-APPLIED MEMBRANE MARKET, BY END-USE INDUSTRY, 2024–2029 (USD MILLION)
                        TABLE 154 REST OF ASIA PACIFIC: LIQUID-APPLIED MEMBRANE MARKET, BY END-USE INDUSTRY, 2021–2023 (MILLION SQUARE METER)
                        TABLE 155 REST OF ASIA PACIFIC: LIQUID-APPLIED MEMBRANE MARKET, BY END-USE INDUSTRY, 2024–2029 (MILLION SQUARE METER)
     11.5 MIDDLE EAST & AFRICA 
             11.5.1 IMPACT OF RECESSION
                        TABLE 156 MIDDLE EAST & AFRICA: LIQUID-APPLIED MEMBRANE MARKET, BY COUNTRY, 2021–2023 (USD MILLION)
                        TABLE 157 MIDDLE EAST & AFRICA: LIQUID-APPLIED MEMBRANE MARKET, BY COUNTRY, 2024–2029 (USD MILLION)
                        TABLE 158 MIDDLE EAST & AFRICA: LIQUID-APPLIED MEMBRANE MARKET, BY COUNTRY, 2021–2023 (MILLION SQUARE METER)
                        TABLE 159 MIDDLE EAST & AFRICA: LIQUID-APPLIED MEMBRANE MARKET, BY COUNTRY, 2024–2029 (MILLION SQUARE METER)
                        TABLE 160 MIDDLE EAST & AFRICA: LIQUID-APPLIED MEMBRANE MARKET, BY END-USE INDUSTRY, 2021–2023 (USD MILLION)
                        TABLE 161 MIDDLE EAST & AFRICA: LIQUID-APPLIED MEMBRANE MARKET, BY END-USE INDUSTRY, 2024–2029 (USD MILLION)
                        TABLE 162 MIDDLE EAST & AFRICA: LIQUID-APPLIED MEMBRANE MARKET, BY END-USE INDUSTRY, 2021–2023 (MILLION SQUARE METER)
                        TABLE 163 MIDDLE EAST & AFRICA: LIQUID-APPLIED MEMBRANE MARKET, BY END-USE INDUSTRY, 2024–2029 (MILLION SQUARE METER)
                        TABLE 164 MIDDLE EAST & AFRICA: LIQUID-APPLIED MEMBRANE MARKET, BY APPLICATION, 2021–2023 (USD MILLION)
                        TABLE 165 MIDDLE EAST & AFRICA: LIQUID-APPLIED MEMBRANE MARKET, BY APPLICATION, 2024–2029 (USD MILLION)
                        TABLE 166 MIDDLE EAST & AFRICA: LIQUID-APPLIED MEMBRANE MARKET, BY APPLICATION, 2021–2023 (MILLION SQUARE METER)
                        TABLE 167 MIDDLE EAST & AFRICA: LIQUID-APPLIED MEMBRANE MARKET, BY APPLICATION, 2024–2029 (MILLION SQUARE METER)
                        TABLE 168 MIDDLE EAST & AFRICA: LIQUID-APPLIED MEMBRANE MARKET, BY TYPE, 2021–2023 (USD MILLION)
                        TABLE 169 MIDDLE EAST & AFRICA: LIQUID-APPLIED MEMBRANE MARKET, BY TYPE, 2024–2029 (USD MILLION)
                        TABLE 170 MIDDLE EAST & AFRICA: LIQUID-APPLIED MEMBRANE MARKET, BY TYPE, 2021–2023 (MILLION SQUARE METER)
                        TABLE 171 MIDDLE EAST & AFRICA: LIQUID-APPLIED MEMBRANE MARKET, BY TYPE, 2024–2029 (MILLION SQUARE METER)
             11.5.2 GCC COUNTRIES
                        TABLE 172 GCC COUNTRIES: LIQUID-APPLIED MEMBRANE MARKET, BY END-USE INDUSTRY, 2021–2023 (USD MILLION)
                        TABLE 173 GCC COUNTRIES: LIQUID-APPLIED MEMBRANE MARKET, BY END-USE INDUSTRY, 2024–2029 (USD MILLION)
                        TABLE 174 GCC COUNTRIES: LIQUID-APPLIED MEMBRANE MARKET, BY END-USE INDUSTRY, 2021–2023 (MILLION SQUARE METER)
                        TABLE 175 GCC COUNTRIES: LIQUID-APPLIED MEMBRANE MARKET, BY END-USE INDUSTRY, 2024–2029 (MILLION SQUARE METER)
                        11.5.2.1 SAUDI ARABIA
                                     11.5.2.1.1 Development of the Jeddah Economic City to drive market
                                                     TABLE 176 SAUDI ARABIA: LIQUID-APPLIED MEMBRANE MARKET, BY END-USE INDUSTRY, 2021–2023 (USD MILLION)
                                                     TABLE 177 SAUDI ARABIA: LIQUID-APPLIED MEMBRANE MARKET, BY END-USE INDUSTRY, 2024–2029 (USD MILLION)
                                                     TABLE 178 SAUDI ARABIA: LIQUID-APPLIED MEMBRANE MARKET, BY END-USE INDUSTRY, 2021–2023 (MILLION SQUARE METER)
                                                     TABLE 179 SAUDI ARABIA: LIQUID-APPLIED MEMBRANE MARKET, BY END-USE INDUSTRY, 2024–2029 (MILLION SQUARE METER)
                        11.5.2.2 UAE
                                     11.5.2.2.1 Growing emphasis on eco-friendly construction solutions to boost market
                                                     TABLE 180 UAE: LIQUID-APPLIED MEMBRANE MARKET, BY END-USE INDUSTRY, 2021–2023 (USD MILLION)
                                                     TABLE 181 UAE: LIQUID-APPLIED MEMBRANE MARKET, BY END-USE INDUSTRY, 2024–2029 (USD MILLION)
                                                     TABLE 182 UAE: LIQUID-APPLIED MEMBRANE MARKET, BY END-USE INDUSTRY, 2021–2023 (MILLION SQUARE METER)
                                                     TABLE 183 UAE: LIQUID-APPLIED MEMBRANE MARKET, BY END-USE INDUSTRY, 2024–2029 (MILLION SQUARE METER)
                        11.5.2.3 Rest of GCC
                                      TABLE 184 REST OF GCC: LIQUID-APPLIED MEMBRANE MARKET, BY END-USE INDUSTRY, 2021–2023 (USD MILLION)
                                      TABLE 185 REST OF GCC: LIQUID-APPLIED MEMBRANE MARKET, BY END-USE INDUSTRY, 2024–2029 (USD MILLION)
                                      TABLE 186 REST OF GCC: LIQUID-APPLIED MEMBRANE MARKET, BY END-USE INDUSTRY, 2021–2023 (MILLION SQUARE METER)
                                      TABLE 187 REST OF GCC: LIQUID-APPLIED MEMBRANE MARKET, BY END-USE INDUSTRY, 2024–2029 (MILLION SQUARE METER)
             11.5.3 SOUTH AFRICA
                        11.5.3.1 Need for effective waterproofing solutions to boost market
                                      TABLE 188 SOUTH AFRICA: LIQUID-APPLIED MEMBRANE MARKET, BY END-USE INDUSTRY, 2021–2023 (USD MILLION)
                                      TABLE 189 SOUTH AFRICA: LIQUID-APPLIED MEMBRANE MARKET, BY END-USE INDUSTRY, 2024–2029 (USD MILLION)
                                      TABLE 190 SOUTH AFRICA: LIQUID-APPLIED MEMBRANE MARKET, BY END-USE INDUSTRY, 2021–2023 (MILLION SQUARE METER)
                                      TABLE 191 SOUTH AFRICA: LIQUID-APPLIED MEMBRANE MARKET, BY END-USE INDUSTRY, 2024–2029 (MILLION SQUARE METER)
             11.5.4 REST OF MIDDLE EAST & AFRICA
                        TABLE 192 REST OF MIDDLE EAST & AFRICA: LIQUID-APPLIED MEMBRANE MARKET, BY END-USE INDUSTRY, 2021–2023 (USD MILLION)
                        TABLE 193 REST OF MIDDLES EAST & AFRICA: LIQUID-APPLIED MEMBRANE MARKET, BY END-USE INDUSTRY, 2024–2029 (USD MILLION)
                        TABLE 194 REST OF MIDDLE EAST & AFRICA: LIQUID-APPLIED MEMBRANE MARKET, BY END-USE INDUSTRY, 2021–2023 (MILLION SQUARE METER)
                        TABLE 195 REST OF MIDDLE EAST & AFRICA: LIQUID-APPLIED MEMBRANE MARKET, BY END-USE INDUSTRY, 2024–2029 (MILLION SQUARE METER)
     11.6 SOUTH AMERICA 
             11.6.1 IMPACT OF RECESSION
                        TABLE 196 SOUTH AMERICA: LIQUID-APPLIED MEMBRANE MARKET, BY COUNTRY, 2021–2023 (USD MILLION)
                        TABLE 197 SOUTH AMERICA: LIQUID-APPLIED MEMBRANE MARKET, BY COUNTRY, 2024–2029 (USD MILLION)
                        TABLE 198 SOUTH AMERICA: LIQUID-APPLIED MEMBRANE MARKET, BY COUNTRY, 2021–2023 (MILLION SQUARE METER)
                        TABLE 199 SOUTH AMERICA: LIQUID-APPLIED MEMBRANE MARKET, BY COUNTRY, 2024–2029 (MILLION SQUARE METER)
                        TABLE 200 SOUTH AMERICA: LIQUID-APPLIED MEMBRANE MARKET, BY END-USE INDUSTRY, 2021–2023 (USD MILLION)
                        TABLE 201 SOUTH AMERICA: LIQUID-APPLIED MEMBRANE MARKET, BY END-USE INDUSTRY, 2024–2029 (USD MILLION)
                        TABLE 202 SOUTH AMERICA: LIQUID-APPLIED MEMBRANE MARKET, BY END-USE INDUSTRY, 2021–2023 (MILLION SQUARE METER)
                        TABLE 203 SOUTH AMERICA: LIQUID-APPLIED MEMBRANE MARKET, BY END-USE INDUSTRY, 2024–2029 (MILLION SQUARE METER)
                        TABLE 204 SOUTH AMERICA: LIQUID-APPLIED MEMBRANE MARKET, BY APPLICATION, 2021–2023 (USD MILLION)
                        TABLE 205 SOUTH AMERICA: LIQUID-APPLIED MEMBRANE MARKET, BY APPLICATION, 2024–2029 (USD MILLION)
                        TABLE 206 SOUTH AMERICA: LIQUID-APPLIED MEMBRANE MARKET, BY APPLICATION, 2021–2023 (MILLION SQUARE METER)
                        TABLE 207 SOUTH AMERICA: LIQUID-APPLIED MEMBRANE MARKET, BY APPLICATION, 2024–2029 (MILLION SQUARE METER)
                        TABLE 208 SOUTH AMERICA: LIQUID-APPLIED MEMBRANE MARKET, BY TYPE, 2021–2023 (USD MILLION)
                        TABLE 209 SOUTH AMERICA: LIQUID-APPLIED MEMBRANE MARKET, BY TYPE, 2024–2029 (USD MILLION)
                        TABLE 210 SOUTH AMERICA: LIQUID-APPLIED MEMBRANE MARKET, BY TYPE, 2021–2023 (MILLION SQUARE METER)
                        TABLE 211 SOUTH AMERICA: LIQUID-APPLIED MEMBRANE MARKET, BY TYPE, 2024–2029 (MILLION SQUARE METER)
             11.6.2 BRAZIL
                        11.6.2.1 Upcoming international sports events to boost market
                                      TABLE 212 BRAZIL: LIQUID-APPLIED MEMBRANE MARKET, BY END-USE INDUSTRY, 2021–2023 (USD MILLION)
                                      TABLE 213 BRAZIL: LIQUID-APPLIED MEMBRANE MARKET, BY END-USE INDUSTRY, 2024–2029 (USD MILLION)
                                      TABLE 214 BRAZIL: LIQUID-APPLIED MEMBRANE MARKET, BY END-USE INDUSTRY, 2021–2023 (MILLION SQUARE METER)
                                      TABLE 215 BRAZIL: LIQUID-APPLIED MEMBRANE MARKET, BY END-USE INDUSTRY, 2024–2029 (MILLION SQUARE METER)
             11.6.3 ARGENTINA
                        11.6.3.1 Growth of construction industry to drive market
                                      TABLE 216 ARGENTINA: LIQUID-APPLIED MEMBRANE MARKET, BY END-USE INDUSTRY, 2021–2023 (USD MILLION)
                                      TABLE 217 ARGENTINA: LIQUID-APPLIED MEMBRANE MARKET, BY END-USE INDUSTRY, 2024–2029 (USD MILLION)
                                      TABLE 218 ARGENTINA: LIQUID-APPLIED MEMBRANE MARKET, BY END-USE INDUSTRY, 2021–2023 (MILLION SQUARE METER)
                                      TABLE 219 ARGENTINA: LIQUID-APPLIED MEMBRANE MARKET, BY END-USE INDUSTRY, 2024–2029 (MILLION SQUARE METER)
             11.6.4 REST OF SOUTH AMERICA
                        TABLE 220 REST OF SOUTH AMERICA: LIQUID-APPLIED MEMBRANE MARKET, BY END-USE INDUSTRY, 2021–2023 (USD MILLION)
                        TABLE 221 REST OF SOUTH AMERICA: LIQUID-APPLIED MEMBRANE MARKET, BY END-USE INDUSTRY, 2024–2029 (USD MILLION)
                        TABLE 222 REST OF SOUTH AMERICA: LIQUID-APPLIED MEMBRANE MARKET, BY END-USE INDUSTRY, 2021–2023 (MILLION SQUARE METER)
                        TABLE 223 REST OF SOUTH AMERICA: LIQUID-APPLIED MEMBRANE MARKET, BY END-USE INDUSTRY, 2024–2029 (MILLION SQUARE METER)
 
12 COMPETITIVE LANDSCAPE (Page No. - 183)
     12.1 OVERVIEW 
     12.2 KEY PLAYER STRATEGIES 
             FIGURE 42 OVERVIEW OF STRATEGIES ADOPTED BY KEY PLAYERS IN LIQUID-APPLIED MEMBRANE MARKET BETWEEN 2019 AND 2023
     12.3 REVENUE ANALYSIS 
             FIGURE 43 REVENUE ANALYSIS OF KEY COMPANIES IN LIQUID-APPLIED MEMBRANE MARKET, 2023
     12.4 MARKET SHARE ANALYSIS 
             FIGURE 44 SHARES OF LEADING COMPANIES IN LIQUID-APPLIED MEMBRANE MARKET, 2023
             TABLE 224 LIQUID-APPLIED MEMBRANE MARKET: DEGREE OF COMPETITION
             12.4.1 MARKET RANKING ANALYSIS
             12.4.2 SIKA AG
             12.4.3 MAPEI S.P.A.
             12.4.4 SOPREMA
             12.4.5 FOSROC, INC.
             12.4.6 SAINT-GOBAIN WEBER
     12.5 COMPANY VALUATION AND FINANCIAL METRICS 
             FIGURE 45 COMPANY VALUATION OF LEADING COMPANIES IN LIQUID-APPLIED MEMBRANE MARKET, 2023
             FIGURE 46 FINANCIAL METRICS OF LEADING COMPANIES IN LIQUID-APPLIED MEMBRANE MARKET, 2023
     12.6 BRAND/PRODUCT COMPARISON 
             FIGURE 47 LIQUID-APPLIED MEMBRANE MARKET: BRAND/PRODUCT COMPARISON
     12.7 COMPANY EVALUATION MATRIX: KEY PLAYERS, 2023 
             12.7.1 STARS
             12.7.2 EMERGING LEADERS
             12.7.3 PERVASIVE PLAYERS
             12.7.4 PARTICIPANTS
                       FIGURE 48 LIQUID-APPLIED MEMBRANE MARKET: COMPANY EVALUATION MATRIX (KEY PLAYERS), 2023
             12.7.5 COMPANY FOOTPRINT: KEY PLAYERS, 2023
                        12.7.5.1 Type footprint
                                      TABLE 225 LIQUID-APPLIED MEMBRANE MARKET: TYPE FOOTPRINT
                        12.7.5.2 Application footprint
                                      TABLE 226 LIQUID-APPLIED MEMBRANE MARKET: APPLICATION FOOTPRINT
                        12.7.5.3 Region footprint
                                      TABLE 227 LIQUID-APPLIED MEMBRANE MARKET: REGION FOOTPRINT
                        12.7.5.4 Company footprint
                                      FIGURE 49 LIQUID-APPLIED MEMBRANE MARKET: COMPANY OVERALL FOOTPRINT
     12.8 COMPANY EVALUATION MATRIX: STARTUPS/SMES, 2023 
             12.8.1 PROGRESSIVE COMPANIES
             12.8.2 RESPONSIVE COMPANIES
             12.8.3 DYNAMIC COMPANIES
             12.8.4 STARTING BLOCKS
                        FIGURE 50 LIQUID-APPLIED MEMBRANE MARKET: COMPANY EVALUATION MATRIX (STARTUPS/SMES), 2023
             12.8.5 COMPETITIVE BENCHMARKING
                        TABLE 228 LIQUID-APPLIED MEMBRANE MARKET: KEY STARTUPS/SMES
                        TABLE 229 LIQUID-APPLIED MEMBRANE MARKET: COMPETITIVE BENCHMARKING OF STARTUPS/SMES
     12.9 COMPETITIVE SCENARIO AND TRENDS 
             12.9.1 PRODUCT LAUNCHES
                        TABLE 230 LIQUID-APPLIED MEMBRANE MARKET: PRODUCT LAUNCHES, MAY 2019–FEBRUARY 2024
             12.9.2 DEALS
                        TABLE 231 LIQUID-APPLIED MEMBRANE MARKET: DEALS, MAY 2019–FEBRUARY 2024
             12.9.3 EXPANSIONS
                        TABLE 232 LIQUID-APPLIED MEMBRANE MARKET: EXPANSIONS, MAY 2019–FEBRUARY 2024
 
13 COMPANY PROFILES (Page No. - 203)
     13.1 KEY PLAYERS 
(Business overview, Products/Solutions/Services offered, Recent Developments, Deals, Expansions, MnM view, Key strengths, Strategic choices, Weaknesses and competitive threats) *
             13.1.1 SIKA AG
                        TABLE 233 SIKA AG: COMPANY OVERVIEW
                        FIGURE 51 SIKA AG: COMPANY SNAPSHOT
                        TABLE 234 SIKA AG: PRODUCTS/SOLUTIONS/SERVICES OFFERED
                        TABLE 235 SIKA AG: DEALS
                        TABLE 236 SIKA AG: EXPANSIONS
             13.1.2 MAPEI S.P.A.
                        TABLE 237 MAPEI S.P.A.: COMPANY OVERVIEW
                        FIGURE 52 MAPEI S.P.A.: COMPANY SNAPSHOT
                        TABLE 238 MAPEI S.P.A.: PRODUCTS/SOLUTIONS/SERVICES OFFERED
                        TABLE 239 MAPEI S.P.A.: DEALS
             13.1.3 SOPREMA
                        TABLE 240 SOPREMA: COMPANY OVERVIEW
                        TABLE 241 SOPREMA: PRODUCTS/SOLUTIONS/SERVICES OFFERED
                        TABLE 242 SOPREMA: DEALS
                        TABLE 243 SOPREMA: EXPANSIONS
             13.1.4 FOSROC, INC.
                        TABLE 244 FOSROC, INC.: COMPANY OVERVIEW
                        TABLE 245 FOSROC, INC.: PRODUCTS/SOLUTIONS/SERVICES OFFERED
                        TABLE 246 FOSROC, INC.: EXPANSIONS
             13.1.5 SAINT-GOBAIN WEBER
                        TABLE 247 SAINT-GOBAIN WEBER: COMPANY OVERVIEW
                        FIGURE 53 SAINT-GOBAIN WEBER: COMPANY SNAPSHOT
                        TABLE 248 SAINT-GOBAIN WEBER: PRODUCTS/SOLUTIONS/SERVICES OFFERED
             13.1.6 H.B. FULLER
                        TABLE 249 H.B. FULLER: COMPANY OVERVIEW
                        FIGURE 54 H.B. FULLER: COMPANY SNAPSHOT
                        TABLE 250 H.B. FULLER: PRODUCTS/SOLUTIONS/SERVICES OFFERED
                        TABLE 251 H.B. FULLER: DEALS
             13.1.7 WACKER CHEMIE AG
                        TABLE 252 WACKER CHEMIE AG: COMPANY OVERVIEW
                        FIGURE 55 WACKER CHEMIE AG: COMPANY SNAPSHOT
                        TABLE 253 WACKER CHEMIE AG: PRODUCTS/SOLUTIONS/SERVICES OFFERED
             13.1.8 JOHNS MANVILLE
                        TABLE 254 JOHNS MANVILLE: COMPANY OVERVIEW
                        TABLE 255 JOHNS MANVILLE: PRODUCTS/SOLUTIONS/SERVICES OFFERED
                        TABLE 256 JOHNS MANVILLE: PRODUCT LAUNCHES
             13.1.9 BOSTIK
                        TABLE 257 BOSTIK: COMPANY OVERVIEW
                        TABLE 258 BOSTIK: PRODUCTS/SOLUTIONS/SERVICES OFFERED
             13.1.10 GCP APPLIED TECHNOLOGIES INC.
                        TABLE 259 GCP APPLIED TECHNOLOGIES INC.: COMPANY OVERVIEW
                        FIGURE 56 GCP APPLIED TECHNOLOGIES INC.: COMPANY SNAPSHOT
                        TABLE 260 GCP APPLIED TECHNOLOGIES INC.: PRODUCTS/SOLUTIONS/SERVICES OFFERED
                        TABLE 261 GCP APPLIED TECHNOLOGIES INC.: DEALS
             13.1.11 ARDEX
                        TABLE 262 ARDEX: COMPANY OVERVIEW
                        TABLE 263 ARDEX: PRODUCTS/SOLUTIONS/SERVICES OFFERED
*Details on Business overview, Products/Solutions/Services offered, Recent Developments, Deals, Expansions, MnM view, Key strengths, Strategic choices, Weaknesses and competitive threats might not be captured in case of unlisted companies.
     13.2 OTHER PLAYERS 
             13.2.1 RENOLIT SE
                        TABLE 264 RENOLIT SE: COMPANY OVERVIEW
             13.2.2 PAUL BAUDER GMBH CO. KG
                        TABLE 265 PAUL BAUDER GMBH CO. KG: COMPANY OVERVIEW
             13.2.3 GAF, INC.
                        TABLE 266 GAF, INC.: COMPANY OVERVIEW
             13.2.4 CARLISLE COMPANIES INC.
                        TABLE 267 CARLISLE COMPANIES INC.: COMPANY OVERVIEW
             13.2.5 PIDILITE
                        TABLE 268 PIDILITE: COMPANY OVERVIEW
             13.2.6 TREMCO INCORPORATED
                        TABLE 269 TREMCO INCORPORATED: COMPANY OVERVIEW
             13.2.7 KEMPER SYSTEM
                        TABLE 270 KEMPER SYSTEM: COMPANY OVERVIEW
             13.2.8 ALCHIMICA
                        TABLE 271 ALCHIMICA: COMPANY OVERVIEW
             13.2.9 AMES RESEARCH LABORATORIES, INC.
                        TABLE 272 AMES RESEARCH LABORATORIES, INC.: COMPANY OVERVIEW
             13.2.10 CHASE CORPORATION
                        TABLE 273 CHASE CORPORATION: COMPANY OVERVIEW
             13.2.11 CHEMBOND CHEMICALS
                        TABLE 274 CHEMBOND CHEMICALS: COMPANY OVERVIEW
             13.2.12 CHEM LINK
                        TABLE 275 CHEM LINK: COMPANY OVERVIEW
             13.2.13 CONCRETE SEALANTS, INC.
                        TABLE 276 CONCRETE SEALANTS, INC.: COMPANY OVERVIEW
             13.2.14 CROMMELIN WATERPROOFING & SEALING
                        TABLE 277 CROMMELIN WATERPROOFING & SEALING: COMPANY OVERVIEW
             13.2.15 ESKOLA ROOFING
                        TABLE 278 ESKOLA ROOFING: COMPANY OVERVIEW
             13.2.16 EVERBUILD BUILDING PRODUCTS LIMITED
                        TABLE 279 EVERBUILD BUILDING PRODUCTS LIMITED: COMPANY OVERVIEW
             13.2.17 HENRY COMPANY
                        TABLE 280 HENRY COMPANY: COMPANY OVERVIEW
             13.2.18 INLAND COATINGS
                        TABLE 281 INLAND COATINGS: COMPANY OVERVIEW
             13.2.19 KARNAK
                        TABLE 282 KARNAK: COMPANY OVERVIEW
             13.2.20 KEY RESIN COMPANY
                        TABLE 283 KEY RESIN COMPANY: COMPANY OVERVIEW
             13.2.21 PROTECTO WRAP COMPANY
                        TABLE 284 PROTECTO WRAP COMPANY: COMPANY OVERVIEW
             13.2.22 XYPEX CHEMICAL CORPORATION
                        TABLE 285 XYPEX CHEMICAL CORPORATION: COMPANY OVERVIEW
 
14 APPENDIX (Page No. - 248)
     14.1 DISCUSSION GUIDE 
     14.2 KNOWLEDGESTORE: MARKETSANDMARKETS’ SUBSCRIPTION PORTAL 
     14.3 CUSTOMIZATION OPTIONS 
     14.4 RELATED REPORTS 
     14.5 AUTHOR DETAILS 

The study involved four major activities in estimating the current market size for liquid-applied membranes. Exhaustive secondary research was conducted to collect information on the market, peer market, and parent market. The next step was to validate these findings, assumptions, and sizing with industry experts across the value chain through primary research. Both top-down and bottom-up approaches were employed to estimate the complete market size. After that, the market breakdown and data triangulation methodologies were used to estimate the market size of segments and subsegments.

Secondary Research

In the secondary research process, various secondary sources such as Factiva, Zauba, Hoovers, and Bloomberg BusinessWeek were referred to for identifying and collecting information for this study. These secondary sources included annual reports, press releases & investor presentations of companies, white papers, certified publications, articles by recognized authors, regulatory bodies, and databases.

Secondary research has been used to obtain key information about the value chain of the industry, monetary chain of the market, the total pool of key players, market classification and segmentation according to industry trends to the bottom-most level, and regional markets. It was also used to obtain information about the key developments from a market-oriented perspective.

Primary Research

The liquid-applied membrane market comprises several stakeholders, such as membrane suppliers, distributors of liquid-applied membranes, system manufacturers, and regulatory organizations in the supply chain. The demand side of this market consists of applications such as roofing, walls, building structures, roadways, and others. Various primary sources from both the supply and demand sides of the market were interviewed to obtain qualitative and quantitative information.

Primary interviews were conducted to gather insights such as market statistics, data of revenue collected from the products and services, market breakdowns, market size estimations, market forecasting, and data triangulation. Primary research also helped in understanding the various trends related to this market. Stakeholders from the demand side, such as CIOs, CTOs, and CSOs were interviewed to understand the buyer’s perspective on the suppliers, products, component providers, and their current usage of liquid-applied membranes and future outlook of their business which will affect the overall market.

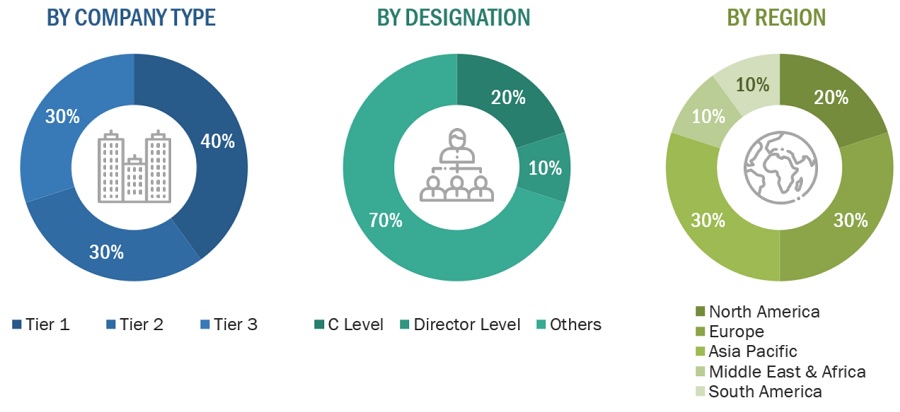
Following is the breakdown of primary respondents.
Applied Membrane Market Size, and Share

To know about the assumptions considered for the study, download the pdf brochure

Market Size Estimation

Both top-down and bottom-up approaches were used to estimate and validate the total size of the liquid-applied membrane market. These methods were also used extensively to determine the size of various subsegments in the market. The research methodology used to estimate the market size includes the following:

  • The key players in the industry and markets were identified through extensive secondary research.
  • The industry’s supply chain and market size, in terms of value and volume, were determined through primary and secondary research processes.
  • All percentage shares, splits, and breakdowns were determined using secondary sources and verified through primary sources.

Liquid-Applied Membrane Market: Bottum-Up Approach

Applied Membrane Market Size, and Share

Note: All the shares are based on the global market size.

Source: Secondary Research, Interviews with Experts, and MarketsandMarkets Analysis

To know about the assumptions considered for the study, Request for Free Sample Report

Liquid-Applied Membrane Market: Top-Down Approach

Applied Membrane Market Size, and Share

Source: Secondary Research, Interviews with Experts, and MarketsandMarkets Analysis

Data Triangulation

After arriving at the overall market size—using the market size estimation process explained above—the market was split into several segments and sub-segments. To complete the overall market engineering process and arrive at the exact statistics of each market segment and subsegment, data triangulation, and market breakdown procedures were employed, wherever applicable. The data was triangulated by studying several factors and trends from both the demand and supply of liquid-applied membranes and their applications.

Market Definition

A liquid-applied membrane refers to a specialized coating utilized in construction for waterproofing and roofing applications. Unlike traditional methods that involve installing pre-manufactured sheets or membranes, liquid-applied membranes are directly applied onto surfaces as a liquid, forming a seamless and fully adhered protective layer. These membranes are formulated from various materials such as polyurethane, cementitious compounds, or bitumen-based solutions, each offering unique properties suited to specific applications and environmental conditions. Liquid-applied membranes are renowned for their versatility, as they can be applied to a wide range of substrates including concrete, metal, wood, and even existing roofing materials. They provide a seamless barrier against water ingress, offering superior protection against leaks, moisture intrusion, and structural damage. Additionally, liquid-applied membranes exhibit excellent flexibility, allowing them to accommodate substrate movement and temperature fluctuations without compromising their integrity.

One of the key advantages of liquid-applied membranes is their ease of application. They can be applied using a variety of methods including spraying, rolling, or troweling, allowing for efficient and cost-effective installation. Furthermore, these membranes can be customized to meet specific project requirements, offering varying levels of thickness, durability, and performance characteristics.

Key Stakeholders

  • Senior Management
  • End User
  • Finance/Procurement Department
  • R&D Department

Objectives of the Study:

  • To define, describe, and forecast the liquid-applied membrane market, in terms of value and volume.
  • To provide detailed information about the key factors (drivers, restraints, opportunities, and challenges) influencing the market growth
  • To analyze and forecast the market by type, usage, application, and end-use industry.
  • To forecast the size of the market for five regions, namely, Asia Pacific, Europe, North America, South America, and the Middle East & Africa along with their key countries
  • To strategically analyze micromarkets with respect to individual growth trends, prospects, and contributions to the total market
  • To analyze the opportunities in the market for stakeholders and provide a competitive landscape for market leaders.
  • To analyze competitive developments, such as new product launches, acquisitions, and expansion undertaken in the market
  • To strategically profile key players and comprehensively analyze their market ranking and core competencies.

Available Customizations:

With the given market data, MarketsandMarkets offers customizations according to the specific requirements of companies. The following customization options are available for the report:

Regional Analysis:

  • Country-level analysis of the liquid-applied membrane market

Company Information:

  • Detailed analysis and profiling of additional market players
Custom Market Research Services

We will customize the research for you, in case the report listed above does not meet with your exact requirements. Our custom research will comprehensively cover the business information you require to help you arrive at strategic and profitable business decisions.

Request Customization
Report Code
CH 3979
Published ON
May, 2024
Choose License Type
BUY NOW
  • SHARE
X
Request Customization
Speak to Analyst
Speak to Analyst
OR FACE-TO-FACE MEETING
PERSONALIZE THIS RESEARCH
  • Triangulate with your Own Data
  • Get Data as per your Format and Definition
  • Gain a Deeper Dive on a Specific Application, Geography, Customer or Competitor
  • Any level of Personalization
REQUEST A FREE CUSTOMIZATION
LET US HELP YOU!
  • What are the Known and Unknown Adjacencies Impacting the Liquid-Applied Membrane Market
  • What will your New Revenue Sources be?
  • Who will be your Top Customer; what will make them switch?
  • Defend your Market Share or Win Competitors
  • Get a Scorecard for Target Partners
CUSTOMIZED WORKSHOP REQUEST
+1-888-600-6441
  • Call Us
  • +1-888-600-6441 (Corporate office hours)
  • +1-888-600-6441 (US/Can toll free)
  • +44-800-368-9399 (UK office hours)
CONNECT WITH US
ABOUT TRUST ONLINE
©2024 MarketsandMarkets Research Private Ltd. All rights reserved
DMCA.com Protection Status Website Feedback