Terminal Automation Market by Offering (Hardware (SCADA, PLC, Security System, Field Devices, Tank Loading Area), Software & Services),Project Type (Brownfield, and Greenfield), Vertical and Geography - Global Forecast to 2022


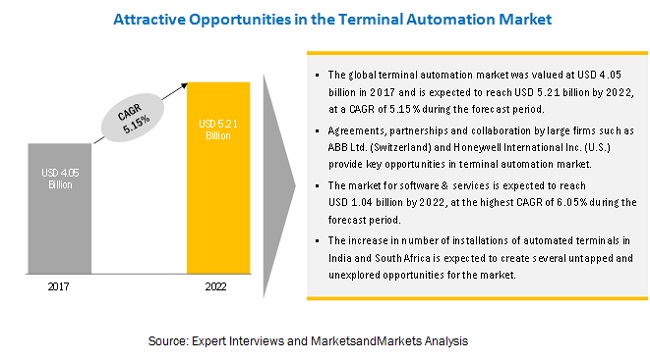
The terminal automation market was valued at USD 3.82 Billion in 2016 and is expected to reach USD 5.21 Billion by 2022, at a CAGR of 5.15% during the forecast period. In this report, 2016 has been considered as the base year, and the forecast for the market size is provided for the period between 2017 and 2022.
Terminal Automation Market For Software & Services Expected To Grow At A Higher Rate
The terminal automation market for hardware is expected grow at a CAGR of 4.94% during the forecast period. The major factor driving the growth of the software & services in the terminal automation market is the increasing demand for automating solutions to improve the operational efficiency of terminals and make them more efficient. Considering this, it is expected that the market for software would grow at the highest CAGR during the forecast period.
Terminal Automation Market, By Offerings, Accounted For The Largest Market Share
The terminal automation market is expected to reach a CAGR of 5.15%, during the forecast period. The major factor driving the growth of the software & services in the terminal automation market is the increasing demand for automating solutions to improve the operational efficiency of terminals and make them more efficient.
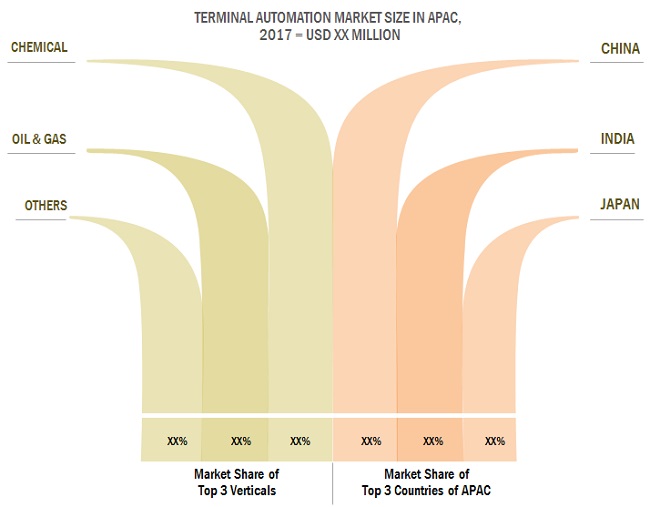
Asia Pacific To Account For The Largest Market Size During The Forecast Period.
The terminal automation market in APAC is expected to grow at a CAGR of 6.74% between 2017 and 2022. The terminal automation market in India was valued at the highest CAGR of 9.50% between 2017 and 2022.
The growing demand for automation due to initiatives such as Make in India as well as the increase in the number of petrochemical projects are some of the key factors contributing to the growth of the terminal automation market in India.
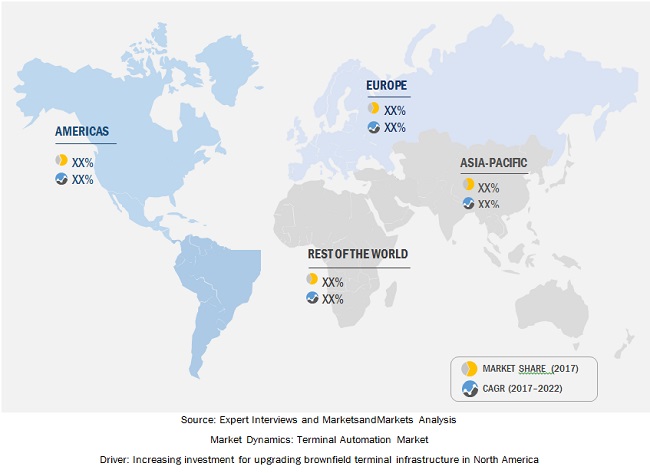
Increasing production of oil and gas has spurred investments to upgrade the existing terminal infrastructure in the North American market. The terminal automation market in North America is moving toward integrated packaging solutions that cater to application-specific requirements of terminal end users. The companies invest in projects that will help to develop midstream infrastructure for the rapidly growing biofuel industry. These projects have a wide scope of retrofitting or building terminals with biofuel blending and storage capabilities, construction of receiving terminals, and development of gathering terminals near several small biofuel producers.
Low capital expenditure for terminal automation projects
Fuel, petrochemicals, and asphalt used at terminals play an important role in the petroleum supply chain. While many fuel terminals are in operation, relatively few are automated. Terminals that are automated often use equipment and systems that are not capable of handling an increasingly complex business and regulatory environment. Considering the high value and the hazardous nature of the products involved in terminal transactions, and the variety of functions performed, most of the world�s petroleum product terminals still operate with minimal automation. Although terminal automation systems help increase efficiencies, improve accuracy, reduce labor and operational costs, enhance safety, and ease regulatory compliance, companies have low capital expenditure (CAPEX) for terminal automation projects.
Opportunity: Upcoming terminal automation projects in Africa and Asia Pacific
With the growing demand for natural gas, such as LNG, several new terminals have been established in Africa and Asia Pacific. Advanced innovative technologies are implemented on new terminals; automation solutions are used to enable support and monitoring at remote sites, cloud-based automation, mobility of control, intelligent event processing, and unmanned platforms. In the oil and gas industry, technological advancements include real-time safety alarms, automated data capture, tank farm automation, custom graphics and user interface, and product movement tracking. These developments are implemented in the oil and gas industry to make terminals more productive and error-free. Innovation and development in information technology have resulted in the advancement of terminal automation.
Challenge: Controlling cyber security threats
With the exploitation of new cost-effective operational concepts, use of digital technologies, and increased dependence on cyber structures, oil and gas and chemical industries are exposed to a new set of vulnerabilities and cyber security threats such as bid lease data, seismic markups, vulnerable software, and damage to intellectual property rights. The cyber-attacks in the oil and gas industry have been increasing rapidly due to the use of digital technology and software, making it more difficult for companies to detect and defend such attacks. Some cyber-attacks go undetected or unreported, as the organizations would not be familiar with the fact that someone has hacked into their systems. Cyber-attack mainly targets the office environment of an oil and gas company, working through the production network and process control and safety systems.
Get online access to the report on the World's First Market Intelligence Cloud
- Easy to Download Historical Data & Forecast Numbers
- Company Analysis Dashboard for high growth potential opportunities
- Research Analyst Access for customization & queries
- Competitor Analysis with Interactive dashboard
- Latest News, Updates & Trend analysis
Request Sample Scope of the Report
Get online access to the report on the World's First Market Intelligence Cloud
- Easy to Download Historical Data & Forecast Numbers
- Company Analysis Dashboard for high growth potential opportunities
- Research Analyst Access for customization & queries
- Competitor Analysis with Interactive dashboard
- Latest News, Updates & Trend analysis

|
Report Metric |
Details |
|
Market size available for years |
2014 � 2016 |
|
Base year considered |
2016 |
|
Forecast period |
2017 � 2022 |
|
Forecast units |
Million (USD) |
|
Segments covered |
Offering, Project Type, Vertical, Geography |
|
Geographies covered |
Americas, Europe, Asia Pacific & Rest of the World |
|
Companies covered |
ABB Ltd., (Switzerland), Honeywell International Inc., (US), Siemens AG (Germany), Yokogawa Electric Corporation (Japan), Rockwell Automation, Inc. (US), Schneider Electric (France), Emerson Electric Co.(US), Endress+Hauser Management AG (Switzerland), TechnipFMC plc (UK), Implico Group (Germany) |
The Terminal Automation Market in this report has been segmented:
erminal Automation Market, by Offering:
- Hardware
- Software & Services
Terminal Automation Market, by Project type
- Brownfield projects
- Greenfield projects
Terminal Automation Market, by Vertical
- Oil & Gas
- Chemical
- Others
Terminal Automation Market, by Region:
- Americas
- Europe
- APAC
- RoW
Key Market Players
ABB Ltd., (Switzerland), Honeywell International Inc., (US), Siemens AG (Germany), Yokogawa Electric Corporation (Japan), Rockwell Automation Inc., (US), Schneider Electric (France), Emerson Electric Co.(US), Endress+Hauser Management AG (Switzerland), TechnipFMC plc (UK), Implico Group (Germany).
ABB Ltd. focuses on both organic and inorganic strategies to maintain its position in the market. For instance, in May 2013, ABB Ltd. (Switzerland) announced a partnership with GlobaLogix to provide a new supervisory control and data acquisition (SCADA) Software-as-a-Service (SaaS) solution that is based on ABB�s SCADAvantage product. The partnership aims to provide a robust and open SCADA service to reduce the operation risks and maintenance burden and also to lower the upfront costs.
Also, in November 2014, ABB Ltd. (Switzerland) signed an agreement with China Petrochemical Corporation (China) to provide a complete set of automation solutions and engineering services to Phase I of the China Petrochemical Corporation�s (China) Shale Gas Project in Jiaoshiba over the next 3 years. According to this agreement, ABB Ltd. (Switzerland) provided smart solutions such as supervisory control and data acquisition (SCADA) system, the extended automation system 800xA-based distributed control system (DCS), a safety instrumentation system, and remote terminal units (RTUs). To increase the automation level and productivity of the project, the company�s control system was used to remotely monitor the entire shale gas production process from collection to distribution through distributed control and centralized management.
Recent Developments
- In November 2014, ABB Ltd. (Switzerland) signed an agreement with China Petrochemical Corporation (China) to provide a complete set of automation solutions and engineering services to Phase I of the Petrochemical Corporation�s (China) Shale Gas Project in Jiaoshiba over the next three years. According to this agreement ABB Ltd. (Switzerland) provided smart solutions such as supervisory control and data acquisition (SCADA) system, the extended automation system 800xA-based distributed control system (DCS), a safety instrumentation system, and remote terminal units (RTUs). To increase the automation level and productivity of the project, the company�s control system was used to remotely monitor the entire shale gas production process from the collection to distribution through distributed control and centralized management.
- Honeywell International Inc. (US) focuses on new product launches and agreement to sustain in the global terminal automation market. In September 2015, Honeywell International Inc. (US) signed an agreement to provide comprehensive services and support for Lundin Norway AS (Norway), an upstream oil and gas company. The new Assurance 360 program Honeywell International Inc. (US) helped the company to achieve continual and optimal performance of its automation system at the Edvard Grieg field.
- Siemens AG (Germany) focuses on new product launches, technology launches, and agreements to optimize its presence in different market segments. In February 2015. Siemens AG (Germany) and Digital Applications International Limited (England) launched a new technology hub to offer oil and gas businesses easy access to a wide range of innovative technologies to help improve process control and safety management.
Key Questions Answered
- Where will all these developments take the industry in the long term?
- What are the upcoming trends for the image sensor market?
- Which segment provides the most opportunity for growth?
- Who are the leading vendors operating in this market?
- What are the opportunities for new market entrants?
To speak to our analyst for a discussion on the above findings, click Speak to Analyst
Table of Contents
1 Introduction (Page No. - 16)
1.1 Objectives of the Study
1.2 Market Definition
1.3 Study Scope
1.3.1 Markets Covered
1.3.2 Years Considered for the Study
1.4 Currency
1.5 Limitations
1.6 Stakeholders
2 Research Methodology (Page No. - 19)
2.1 Research Data
2.1.1 Secondary Data
2.1.1.1 Key Data From Secondary Sources
2.1.2 Primary Data
2.1.2.1 Primary Interviews With Experts
2.1.2.2 Breakdown of Primaries
2.1.2.3 Key Data From Primary Sources
2.1.3 Secondary and Primary Research
2.1.3.1 Key Industry Insights
2.2 Market Size Estimation
2.2.1 Bottom-Up Approach
2.2.1.1 Approach for Capturing the Market Share By Bottom-Up Analysis (Demand Side)
2.2.2 Top-Down Approach
2.2.2.1 Approach for Capturing the Market Share By Top-Down Analysis (Supply Side)
2.3 Market Breakdown & Data Triangulation
2.4 Research Assumptions
3 Executive Summary (Page No. - 30)
4 Premium Insight (Page No. - 35)
4.1 Attractive Opportunities in the Terminal Automation Market
4.2 Terminal Automation : By Tank Loading Area
4.3 Americas to Hold the Largest Share of the Terminal Automation in 2017
4.4 China Estimated to Dominate the Terminal Automation in APAC in 2017
4.5 Terminal Automation, By Project Type
5 Market Overview (Page No. - 39)
5.1 Introduction
5.2 Terminal Automation Architecture
5.2.1 Field Layer
5.2.2 Control and Automation
5.2.3 Business Layer
5.3 Market Dynamics
5.3.1 Drivers
5.3.1.1 Increasing Investment for Upgrading Brownfield Terminal Infrastructure in North America
5.3.1.2 Adherence to Environmental and Safety Regulations
5.3.1.3 Growing Demand for Environmentally Cleaner Fuel Results in the Increased Adoption of Natural Gas
5.3.2 Restraints
5.3.2.1 Reduction in Crude Oil Prices Impacts the Upstream Oil and Gas Terminal Automation Market
5.3.2.2 Low Capital Expenditure for Terminal Automation Projects
5.3.2.3 Dependence on the Regulatory Authority for Approval Results in Project Delays
5.3.3 Opportunities
5.3.3.1 Upcoming Terminal Automation Projects in Africa and Asia Pacific
5.3.3.2 Integration of Cloud Technologies Across All Verticals
5.3.4 Challenges
5.3.4.1 Controlling Cyber Security Threats
6 Industry Trends (Page No. - 48)
6.1 Value Chain Analysis
6.2 Regulatory Standards
7 Terminal Automation Market, By Offerings (Page No. - 50)
7.1 Introduction
7.2 Hardware
7.2.1 Systems
7.2.1.1 Control Systems
7.2.1.1.1 Scada System
7.2.1.1.2 PLC
7.2.1.1.3 DCS
7.2.1.2 Security Systems
7.2.1.2.1 Emergency Shutdown System
7.2.1.2.2 Gas Monitoring System
7.2.1.2.3 Fire Protection System
7.2.1.2.4 Valve Control System
7.2.1.2.5 Leak Detection System
7.2.1.2.6 Access Control System
7.2.2 Field Devices
7.2.2.1 Tank Gauging System
7.2.2.1.1 Transmitters
7.2.2.1.1.1 Pressure
7.2.2.1.1.2 Flow
7.2.2.1.1.3 Level
7.2.2.1.1.4 Temperature
7.2.2.2 Cctv
7.2.2.3 Others
7.2.3 Tank Loading Area
7.2.3.1 Trucks
7.2.3.2 Pipelines
7.2.3.3 Others
7.3 Software & Services
8 Terminal Automation Market, By Project Type (Page No. - 65)
8.1 Introduction
8.2 Brownfield Projects
8.3 Greenfield Projects
9 Terminal Automation Market, By Vertical (Page No. - 73)
9.1 Introduction
9.2 Oil & Gas
9.2.1 Upstream
9.2.2 Midstream
9.2.3 Downstream
9.3 Chemical
9.3.1 Petrochemical
9.3.2 Others
9.4 Others
10 Geographic Analysis (Page No. - 85)
10.1 Introduction
10.2 Americas
10.2.1 Increasing Investments for Upgrading Brownfield Terminal Infrastructure
10.2.2 North America
10.2.2.1 Increase in Capital Expenditure to Fund Shale Gas
10.2.2.2 U.S.
10.2.2.2.1 More Dependence on Liquefaction of Liquefied Gas Projects
10.2.2.3 Canada
10.2.2.3.1 Major Exporter of Crude Oil in North America
10.2.2.4 Rest of North America
10.2.3 Latin America
10.2.3.1 Privatization Leads to Major Investment in the Petroleum Sector
10.2.3.2 Mexico
10.2.3.2.1 Reforms in the Energy Sector Have Attracted Foreign Direct Investment in This Country
10.2.3.3 Argentina
10.2.3.3.1 Dependence on Federal Funds for the Development of the Hydrocarbons Industry
10.2.3.4 Brazil
10.2.3.4.1 Investments By the Chemical Companies Initiate the Business in the Chemical Sector
10.2.3.5 Rest of Latin America
10.3 Europe
10.3.1 Decline in the Downstream Sector Reduces the Refining Capacity in the Country
10.3.2 Russia
10.3.2.1 Increasing Investments By the Companies in the Petrochemical Industry
10.3.3 Germany
10.3.3.1 Highly Structured Chemical Industry Contributes to the Innovative Strength
10.3.4 Italy
10.3.4.1 Less Spending By Public and Private Companies in Oil & Gas Exploration Activities
10.3.5 France
10.3.5.1 Rapid Growth in the Chemical Industry Creates More Job Opportunities
10.3.6 Spain
10.3.6.1 Growing Water Shortages Create Demand for Water Desalination Projects
10.3.7 Rest of Europe
10.4 APAC
10.4.1 Increase in Demand for Liquefied Natural Gas Projects
10.4.2 China
10.4.2.1 Green Development Projects in the Oil & Gas Industry
10.4.3 India
10.4.3.1 Increase in Government Funds for Technology Upgradation to Boost Growth in the Chemical Industry
10.4.4 Japan
10.4.4.1 Growth in Petrochemical Industry Contributes to the Increase in Gross Domestic Product in the Country
10.4.5 Australia
10.4.5.1 Rapid Industrialization Drives Growth in the Oil & Gas Industry
10.4.6 Malaysia
10.4.6.1 Use of Technology Facilitates the Delivery of Hydrocarbon Resources
10.4.7 Indonesia
10.4.7.1 Development of Petrochemical Industry Accelerates the Economic Growth
10.4.8 Rest of APAC
10.5 RoW
10.5.1 Investment in Digital Technologies Increases the Operational Efficiencies in the Oil & Gas Industry
10.5.2 Middle East
10.5.2.1 Decline in the Global Oil Prices Impacts the Upstream Sector
10.5.2.2 Iran
10.5.2.2.1 Rapid Development in the Petrochemical Industry
10.5.2.3 Saudi Arabia
10.5.2.3.1 Plans to Invest in New Projects and Simultaneously Upgrade the Existing Facilities
10.5.2.4 UAE
10.5.2.4.1 Strong Dependence on Hydrocarbons Demands the Participation of Private Sectors
10.5.2.5 Rest of Middle East
10.5.3 Africa
10.5.3.1 Government Initiatives to Make Better Use of Energy Resources
10.5.3.2 South Africa
10.5.3.2.1 Upstream Sector Largely Dominated By the South African Government
10.5.3.3 Rest of South Africa
11 Competitive Landscape (Page No. - 114)
11.1 Introduction
11.2 Market Ranking Analysis: Terminal Automation
11.3 Vendor Dive Overview
11.3.1 Vanguard (Leaders)
11.3.2 Dynamic
11.3.3 Innovator
11.3.4 Emerging
11.4 Competitive Benchmarking Terminal Automation : Product Portfolio Analysis (25 Companies)
11.5 Business Strategy Terminal Automation : Business Strategy Analysis (25 Companies)
Top 25 Companies Analysed for This Study Are- ABB Ltd.; Siemens Ag; Schneider Electric; Honeywell International Inc. ; Rockwell Automation, Inc. ; Yokogawa Electric Corp. ; Emerson Electric Co. ; Endress+Hauser Ag; Technipfmc PLC; Implico, Chemtrols Industries Pvt. Ltd. ; Petronas Carigali Sdn Bhd; Saudi Arabian Oil Co. ; Koninklijke Vopak Nv; Larsen and Toubro; Toptech Systems; Cimation; Varec, Inc. ; Mofatt & Nichol; Zebra Technologies Corporation; Fabtech Projects & Engineers Ltd. ; Total Meter Services, Inc ; Inter Terminals Ltd. ; Intech Process Automation Inc; and Synergy Systems & Solutions
12 Company Profiles (Page No. - 120)
(Business Overview, Products Offered & Services Strategies, Key Insights, Recent Developments, MnM View)*
12.1 ABB Ltd.
12.2 Honeywell International Inc.
12.3 Siemens AG
12.4 Yokogawa Electric Corporation
12.5 Rockwell Automation, Inc.
12.6 Schneider Electric
12.7 Emerson Electric Co.
12.8 Endress+Hauser Management AG
12.9 Technipfmc PLC
12.10 Implico Group
12.11 Key Innovators & Startups
12.11.1 Inter Terminals Ltd.
12.11.2 Larsen & Toubro Limited
12.11.3 Varec, Inc.
12.11.4 Intech Process Automation Inc.
*Details on Business Overview, Products Offered & Services Strategies, Key Insights, Recent Developments, MnM View Might Not Be Captured in Case of Unlisted Companies.
13 Appendix (Page No. - 155)
13.1 Insights of Industry Experts
13.2 Discussion Guide
13.3 Knowledge Store: Marketsandmarkets� Subscription Portal
13.4 Introducing RT: Real-Time Market Intelligence
13.5 Available Customizations
13.6 Related Reports
13.7 Author Details
List of Tables (68 Tables)
Table 1 List of Major Secondary Sources
Table 2 Brownfield Terminal Automation Projects in North America
Table 3 Global Terminal Automation Projects, 2016�2017
Table 4 Terminal Automation : Regulatory Standards
Table 5 Terminal Automation, By Offerings, 2014�2022 (USD Million)
Table 6 Terminal Automation for Hardware, By Project Type, 2014�2022 (USD Million)
Table 7 Terminal Automation, By Hardware, 2014�2022 (USD Million)
Table 8 Terminal Automation for Systems, By Project Type, 2014�2022 (USD Million)
Table 9 Terminal Automation, By Systems, 2014�2022 (USD Million)
Table 10 Terminal Automation for Control Systems, By Project Type, 2014�2022 (USD Million)
Table 11 Terminal Automation Market, By Control Systems, 2014�2022 (USD Million)
Table 12 Terminal Automation for Security Systems, By Project Type, 2014�2022 (USD Million)
Table 13 Terminal Automation for Field Devices, By Project Type, 2014�2022 (USD Million)
Table 14 Market, By Transmitter, 2014�2022 (USD Million)
Table 15 Terminal Automation for Tank Loading Area, By Project Type, 2014�2022 (USD Million)
Table 16 Terminal Automation Market, By Tank Loading Area, 2014�2022 (USD Million)
Table 17 Market for Tank Loading Area for Truck, By Project Type, 2014�2022 (USD Million)
Table 18 Terminal Automation Market for Tank Loading Area for Pipeline, By Project Type, 2014�2022 (USD Million)
Table 19 Terminal Automation Market for Tank Loading Area for Others, By Project Type, 2014�2022 (USD Million)
Table 20 Terminal Automation Market for Software & Services, By Project Type, 2014�2022 (USD Million)
Table 21 Market, By Project Type, 2014�2022 (USD Million)
Table 22 Brownfield Market, By Offerings, 2014�2022 (USD Million)
Table 23 Brownfield Market, By Hardware, 2014�2022 (USD Billion)
Table 24 Brownfield Market, By Systems, 2014�2022 (USD Million)
Table 25 Brownfield Market, By Tank Loading Area, 2014�2022 (USD Million)
Table 26 Brownfield Market, By Vertical, 2014�2022 (USD Million)
Table 27 Greenfield Market, By Offerings, 2014�2022 (USD Million)
Table 28 Greenfield Market, By Hardware, 2014�2022 (USD Million)
Table 29 Greenfield Market, By Systems, 2014�2022 (USD Million)
Table 30 Greenfield Market, By Tank Loading Area, 2014�2022 (USD Million)
Table 31 Greenfield Market, By Vertical, 2014�2022 (USD Million)
Table 32 Terminal Automation Market, By Vertical, 2014�2022 (USD Million)
Table 33 Terminal Automation Market for Oil & Gas, By Project Type, 2014�2022 (USD Million)
Table 34 Automation Market for Oil & Gas, By Region, 2014�2022 (USD Million)
Table 35 Automation Market for Oil & Gas, By Type, 2014�2022 (USD Million)
Table 36 Market for Upstream Oil & Gas, By Region, 2014�2022 (USD Million)
Table 37 Automation Market for Midstream Oil & Gas, By Region, 2014�2022 (USD Million)
Table 38 Automation Market for Downstream Oil & Gas, By Region, 2014�2022 (USD Million)
Table 39 Market for Chemical, By Project Type, 2014�2022 (USD Million)
Table 40 Automation Market for Chemical, By Region, 2014�2022 (USD Million)
Table 41 Automation Market for Chemical Vertical, 2014�2022 (USD Million)
Table 42 Automation Market for Petrochemical, By Region, 2014�2022 (USD Million)
Table 43 Terminal Automation Market for Other Chemical Vertical, By Region, 2014�2022 (USD Million)
Table 44 Automation Market for Other Verticals, By Project Type, 2014�2022 (USD Million)
Table 45 Market for Other Verticals, By Region, 2014�2022 (USD Million)
Table 46 Market, By Region, 2014�2022 (USD Million)
Table 47 Terminal Automation Market in Americas, By Region, 2014�2022 (USD Million)
Table 48 Terminal Automation Market in Americas, By Vertical, 2014�2022 (USD Million)
Table 49 Terminal Automation Market in Americas, By Others Vertical, 2014�2022 (USD Million)
Table 50 Market in Americas for Oil & Gas Vertical, By Type, 2014�2022 (USD Million)
Table 51 Terminal Automation Market in Americas for Chemical Vertical, By Type, 2014�2022 (USD Million)
Table 52 Market in North America, By Country, 2014�2022 (USD Million)
Table 53 Terminal Automation Market in Latin America, By Country, 2014�2022 (USD Million)
Table 54 Terminal Automation Market in Europe, By Country, 2014�2022 (USD Million)
Table 55 Terminal Automation Market in Europe, By Vertical, 2014�2022 (USD Million)
Table 56 Market in Europe for Oil & Gas Vertical, By Type, 2014�2022 (USD Million)
Table 57 Market in Europe for Chemical Vertical, By Type, 2014�2022 (USD Million)
Table 58 Market in APAC, By Country, 2014�2022 (USD Million)
Table 59 Market in APAC, By Vertical, 2014�2022 (USD Million)
Table 60 Market in APAC for Oil & Gas Vertical, By Type, 2014�2022 (USD Million)
Table 61 Market in APAC for Chemical Vertical, By Type, 2014�2022 (USD Million)
Table 62 Market in RoW, By Region, 2014�2022 (USD Million)
Table 63 Market in RoW, By Vertical, 2014�2022 (USD Million)
Table 64 Market in RoW for Oil & Gas Vertical, By Type, 2014�2022 (USD Million)
Table 65 Market in RoW for Chemical Vertical, By Type, 2014�2022 (USD Million)
Table 66 Market in Middle East, By Country, 2014�2022 (USD Million)
Table 67 Market in Africa, By Country, 2014�2022 (USD Million)
Table 68 Market Ranking of the Top 5 Players in the Market, 2016
List of Figures (54 Figures)
Figure 1 Terminal Automation Market: Research Design
Figure 2 Bottom-Up Approach to Arrive at the Market Size
Figure 3 Top-Down Approach to Arrive at the Market Size
Figure 4 Data Triangulation
Figure 5 Assumptions of the Research Study
Figure 6 Terminal Automation for Software & Services Expected to Grow at A Higher Rate Between 2017 and 2022
Figure 7 Terminal Automation for Tank Loading Area Expected to Grow at the Highest Rate During the Forecast Period
Figure 8 Terminal Automation for Chemical Vertical to Grow at the Highest Rate During the Forecast Period
Figure 9 Terminal Automation for Midstream in Oil & Gas Vertical to Grow at the Highest Rate During the Forecast Period
Figure 10 Terminal Automation in APAC Expected to Grow at the Highest Rate Between 2017 and 2022
Figure 11 Significant Increase in the Number of Brownfield Projects Expected to Drive the Market During the Forecast Period
Figure 12 Automation of Trucks to Grow at the Highest Rate in the Market During the Forecast Period
Figure 13 India Expected to Witness the Highest Growth Rate During the Forecast Period
Figure 14 Chemical Vertical Estimated to Hold the Largest Market Share in APAC in 2017
Figure 15 Brownfield Projects Estimated to Grow at A Higher CAGR Between 2017 and 2022
Figure 16 Terminal Automation Architecture
Figure 17 Upcoming Terminal Automation Projects in Africa and Asia Pacific Expected to Drive Opportunities in the Market
Figure 18 Comparative Analysis of Crude Oil Prices
Figure 19 Major Value is Added During the Hardware Components, Software Solutions, & System Integrators Phase
Figure 20 Terminal Automation : By Offerings
Figure 21 Terminal Automation : By Hardware
Figure 22 Terminal Automation : By Systems
Figure 23 Terminal Automation : By Field Device
Figure 24 Brownfield Project Type for Market in Pipeline Tank Loading Area Expected to Grow at A Higher Rate During the Forecast Period
Figure 25 Market: By Project Type
Figure 26 Market for Security Systems to Grow at A Higher Rate During the Forecast Period
Figure 27 Terminal Automation Market for Tank Loading Area to Grow at the Highest Rate During the Forecast Period
Figure 28 Market: By Vertical
Figure 29 Market: By Oil and Gas Vertical
Figure 30 APAC Expected to Witness the Highest Growth in the Market for Midstream Oil & Gas Vertical
Figure 31 Petrochemicals Expected to Witness Higher Growth Rate in the Terminal Automation for Chemical Vertical
Figure 32 Terminal Automation Segmentation: By Geography
Figure 33 Geographic Snapshot: Market in APAC Expected to Grow at the Highest Rate During the Forecast Period
Figure 34 Terminal Automation Market in India is Estimated to Grow at the Highest Rate Between 2016 and 2022
Figure 35 Segmentation: the Americas
Figure 36 Americas: Market Snapshot
Figure 37 Segmentation: North America
Figure 38 Segmentation: Latin America
Figure 39 Segmentation: Europe
Figure 40 Segmentation: APAC
Figure 41 APAC: Market Snapshot
Figure 42 Segmentation: RoW
Figure 43 Segmentation: Middle East
Figure 44 Segmentation: Africa
Figure 45 Key Growth Strategies Adopted By Top Companies, 2013�2017
Figure 46 Dive Chart
Figure 47 ABB Ltd.: Company Snapshot (2015)
Figure 48 Honeywell International Inc.: Company Snapshot (2015)
Figure 49 Siemens AG: Company Snapshot (2016)
Figure 50 Yokogawa Electric Corp.: Company Snapshot (2016)
Figure 51 Rockwell Automation, Inc.: Company Snapshot (2016)
Figure 52 Schneider Electric: Company Snapshot (2015)
Figure 53 Emerson Electric Co.: Company Snapshot (2016)
Figure 54 Endress+ Hauser Management AG: Company Snapshot (2015)


Growth opportunities and latent adjacency in Terminal Automation Market
Can you provide information on ongoing TAS projects in India by companies�ABB, Siemens, Emerson, Honeywell, Yokogawa, E&H, Schneider, Rockwell etc....
Would be interested in Terminal Automation System data for Product�DCS, SCADA, PLC, HMI, Process Safety System, Automatic Tank Gauging, Blending Controls & Security
We are looking for information on the market data for various projects like MultiLoad II, AccuLoad III, DanLoad, etc.
I am looking for operational data for most developed and Safe Oil terminals around the world, details of Equiments installed with regional insights.
Having working in the terminal automation industry for 25 years, I am seeing up my own consulting business and I believe automation is key to future success in many industries including oil and gas. I would like to learn further about this market from you report.
Need terminal automation system market data for oil and gas application. What are the different system type for terminal automation/management systems you have included in study
Do you have something like a single user or single person version of this report ? Something that is less expensive? Maybe something I can only read online without downloading or printing? Since I am new to this space I am trying to do as much research as possible to not only learn the space, but also to adopt strategies competition my company would face in te yeas to come. Thank you very much! Peter
Technical aspect and analysis specifically in DCS, SCADA, PLC, HMI, PSS, AND BLENDING CONTROL. Detail of main suppliers of TAS, and the fuel terminals future directions and New technologies.