
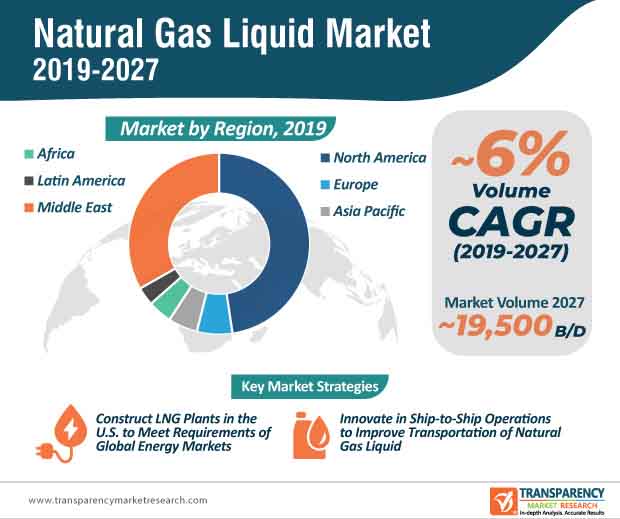
The global natural gas liquid market is projected to register a CAGR of 6% from 2019 to 2027 (forecast period). Natural gas liquids (NGL) are liquid components of natural gas that have been separated from the gas state. Condensation, absorption, and other methods are used in the gas processing facility to separate NGLs from gas. Butane, propane, ethane, and pentanes are the most common NGLs.
The worldwide natural gas liquid market has experienced rapid growth in recent years. Natural gas liquids are increasingly being consumed in the residential, commercial, and industrial sectors, which is boosting the natural gas liquid market. Domestic applications of these liquids have aided in growing sales around the globe. Moreover, plastics, detergent production, and anti-freeze agents are some of the most common sectors that use natural gas liquids.
With increasing standards of living and environmental concerns, the usage of NGLs products is on the rise. NGLs products such as propane and butane are widely used as a fuel in furnaces for heating, cooking, as an energy source for heating systems, laundry dryers, grills, and portable stoves. The upsurge in consumption of such products for cooking, heating, and burning purposes is expected to boost the natural gas liquid market.
Natural gas prices have been declining since 2009, but they fell dramatically in 2012. With a few exceptions, this lower trend in natural gas prices is likely to continue throughout the projection period. Natural gas prices have fallen due to oversupply and poor demand. However, natural gas output has not declined and is not expected to decline throughout the projection period. Natural gas processing plant operators and natural gas producers have begun to focus on natural gas liquids in order to increase profitability and maintain company operations stable, as NGLs have higher pricing and are in more demand. Thus, reduced natural gas prices and poor demand for natural gas are expected to propel the natural gas liquid market throughout the projected period.
Request a sample to get extensive insights into the Natural Gas Liquid Market
Crude oil prices are influenced by events that might impair oil and gas supply. These include geopolitical events and weather-related difficulties. Geopolitical events are a key element that might cause uncertainty regarding future supply or demand for oil and gas. This might lead to increased volatility in oil and gas prices. The Middle East accounts for a sizable portion of the worldwide oil and gas business. It is an extremely volatile region due to political difficulties that generate concern among investors interested in oil and gas development. Since the drop in crude oil prices in 2014, oil and gas costs have steadily risen. The fluctuation in crude oil prices has an impact on oil and gas output. This, in turn, is likely to constrain the worldwide natural gas liquid market from 2019 to 2027.
To understand how our report can bring difference to your business strategy, Ask for a brochure
Stuck in a neck-to-neck competition with other brands? Request a custom report on Natural Gas Liquid Market
North America is expected to be a promising region of the worldwide market during the projected period. The North American natural gas liquid market is expected to grow rapidly during the forecast period, owing to a large overall increase in NGL output levels (from refineries and gas plants combined). The fast expansion in natural gas output from alternative sources, including tight, shale, and coal-bed methane deposits, has increased the natural gas liquids output from gas plants in the United States.
By 2025, the U.S. market is expected to surpass 3 million barrels per day in annual consumption. The fast growth of the shale gas sector, low natural gas liquids costs and decreasing reliance on other nations for energy imports have all contributed to a significant increase in NGL usage. Additionally, supply cost savings, currency exchange rate volatility, and product monetization are expected to influence natural gas liquid market growth positively.
Key players active in the worldwide natural gas liquid market are ConocoPhillips Company, Exxon Mobil Corporation, Equinor ASA, BP Plc., SM Energy, Silver BoW resources, and Royal Dutch Shell Plc.
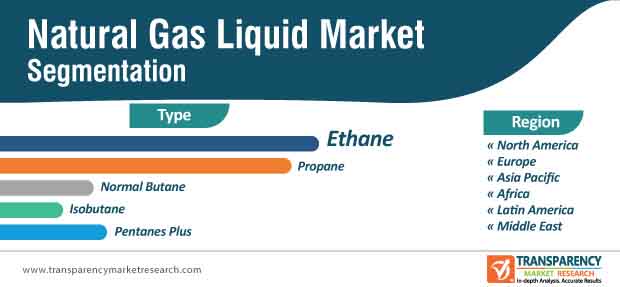
Natural Gas Liquid Market – Segmentation
TMR’s research study assesses the global natural gas liquid market based on type and region. The report presents extensive market dynamics and progressive trends associated with different segments of the market and how they are influencing growth prospects for the global natural gas liquid market.
|
Type |
Ethane Propane Normal Butane Isobutane Pentanes Plus |
|
Region |
North America Europe Asia Pacific Africa Latin America Middle East |
Natural Gas Liquid Market is expected to reach 19,500 Thousand B/D By 2027
Natural Gas Liquid Market is estimated to rise at a CAGR of 6% during forecast period
Increasing use of natural gas liquids (NGLs) in petrochemical applications is expected to drive the global natural gas liquid market during the forecast period
North America is more attractive for vendors in the Natural Gas Liquid Market
Key players of Natural Gas Liquid Market are ConocoPhillips Company, Exxon Mobil Corporation, Equinor ASA, BP Plc., SM Energy, Silver BoW resources, and Royal Dutch Shell Plc
1. Executive Summary
1.1. Market Outlook
1.2. Key Facts and Figures
1.3. Key Trends
2. Market Overview
2.1. Market Segmentation
2.2. Market Indicators
3. Market Dynamics
3.1. Drivers and Restraints Snapshot Analysis
3.1.1.1. Drivers
3.1.1.2. Restraints
3.1.1.3. Opportunities
3.2. Porter’s Five Forces Analysis
3.2.1. Threat of Substitutes
3.2.2. Bargaining Power of Buyers
3.2.3. Bargaining Power of Suppliers
3.2.4. Threat of New Entrants
3.2.5. Degree of Competition
3.3. Regulatory Scenario
3.4. Volume Chain Analysis
4. Global Natural Gas Liquid Market Volume (Thousand B/D) Analysis, by Type
4.1. Key Findings and Introduction
4.2. Global Natural Gas Liquid Market Volume (Thousand B/D) Forecast, by Type, 2018–2027
4.2.1. Global Natural Gas Liquid Market Volume (Thousand B/D) Forecast, by Ethane, 2018–2027
4.2.2. Global Natural Gas Liquid Market Volume (Thousand B/D) Forecast, by Propane, 2018–2027
4.2.3. Global Natural gas liquid s Market Volume (Thousand B/D) Forecast, by Normal Butane, 2018–2027
4.2.4. Global Natural Gas Liquid Market Volume (Thousand B/D) Forecast, by Isobutane, 2018–2027
4.2.5. Global Natural Gas Liquid Market Volume (Thousand B/D) Forecast, by Pentanes Plus, 2018–2027
4.3. Global Natural Gas Liquid Market Attractiveness Analysis, by Type
5. Global Natural Gas Liquid Market Analysis, by Region
5.1. Key Findings
5.2. Global Natural Gas Liquid Market Volume (Thousand B/D) Forecast, by Region
5.2.1. North America
5.2.2. Europe
5.2.3. Asia Pacific
5.2.4. Africa
5.2.5. Latin America
5.2.6. Middle East
5.3. Global Natural Gas Liquid Market Attractiveness Analysis, by Region
6. North America Natural Gas Liquid Market Overview
6.1. Key Findings
6.2. North America Natural Gas Liquid Market Volume (Thousand B/D) Forecast, by Type, 2018–2027
6.3. North America Natural Gas Liquid Market Volume (Thousand B/D) Forecast, by Country
6.3.1. U.S. Natural Gas Liquid Market Volume (Thousand B/D) Forecast, by Type, 2018–2027
6.3.2. Canada Natural Gas Liquid Market Volume (Thousand B/D) Forecast, by Type, 2018–2027
6.4. North America Natural Gas Liquid Market Attractiveness Analysis, by Type
6.5. North America Natural Gas Liquid Market Attractiveness Analysis, by Country
7. Europe Natural Gas Liquid Market Overview
7.1. Key Findings
7.2. Europe Natural Gas Liquid Market Volume (Thousand B/D) Forecast, by Type, 2018–2027
7.3. Europe Natural Gas Liquid Market Volume (Thousand B/D) Forecast, by Country and Sub-region, 2018–2027
7.3.1. Norway Natural Gas Liquid Market Volume (Thousand B/D) Forecast, by Type, 2018–2027
7.3.2. Russia Natural Gas Liquid Market Volume (Thousand B/D) Forecast, by Type, 2018–2027
7.3.3. U.K. Natural Gas Liquid Market Volume (Thousand B/D) Forecast, by Type, 2018–2027
7.3.4. Netherlands Natural Gas Liquid Market Volume (Thousand B/D) Forecast, by Type, 2018–2027
7.3.5. Rest of Europe Natural Gas Liquid Market Volume (Thousand B/D) Forecast, by Type, 2018–2027
7.4. Europe Natural Gas Liquid Market Attractiveness Analysis, by Type
7.5. Europe Natural Gas Liquid Market Attractiveness Analysis, by Country and Sub-region
8. Asia Pacific Natural Gas Liquid Market Overview
8.1. Key Findings
8.2. Asia Pacific Natural Gas Liquid Market Volume (Thousand B/D) Forecast, by Type, 2018–2027
8.3. Asia Pacific Natural Gas Liquid Market Volume (Thousand B/D) Forecast, by Country and Sub-region, 2018–2027
8.3.1. Indonesia Natural Gas Liquid Market Volume (Thousand B/D) Forecast, by Type, 2018–2027
8.3.2. Australia Natural Gas Liquid Market Volume (Thousand B/D) Forecast, by Type
8.3.3. India Natural Gas Liquid Market Volume (Thousand B/D) Forecast, by Type
8.3.4. Rest of Asia Pacific Natural Gas Liquid Market Volume (Thousand B/D) Forecast, by Type
8.4. Asia Pacific Natural Gas Liquid Market Attractiveness Analysis, by Type
8.5. Asia Pacific Natural Gas Liquid Market Attractiveness Analysis, by Country and Sub-region
9. Africa Natural Gas Liquid Market Overview
9.1. Key Findings
9.2. Africa Natural Gas Liquid Market Volume (Thousand B/D) Forecast, by Type, 2018–2027
9.3. Africa Natural Gas Liquid Market Volume (Thousand B/D) Forecast, by Country and Sub-region, 2018–2027
9.3.1. Algeria Natural Gas Liquid Market Volume (Thousand B/D) Forecast, by Type, 2018–2027
9.3.2. Nigeria Natural Gas Liquid Market Volume (Thousand B/D) Forecast, by Type
9.3.3. Rest of Africa Natural Gas Liquid Market Volume (Thousand B/D) Forecast, by Type
9.4. Africa Pacific Natural Gas Liquid Market Attractiveness Analysis, by Type
9.5. Africa Pacific Natural Gas Liquid Market Attractiveness Analysis, by Country and Sub-region
10. Latin America Natural Gas Liquid Market Overview
10.1. Key Findings
10.2. Latin America Natural Gas Liquid Market Volume (Thousand B/D) Forecast, by Type, 2018–2027
10.3. Latin America Natural Gas Liquid Market Volume (Thousand B/D) Forecast, by Country and Sub-region, 2018–2027
10.3.1. Argentina Natural Gas Liquid Market Volume (Thousand B/D) Forecast, by Type, 2018–2027
10.3.2. Brazil Natural Gas Liquid Market Volume (Thousand B/D) Forecast, by Type, 2018–2027
10.3.3. Venezuela Natural Gas Liquid Market Volume (Thousand B/D) Forecast, by Type, 2018–2027
10.3.4. Rest of Latin America Natural Gas Liquid Market Volume (Thousand B/D) Forecast, by Type, 2018–2027
10.4. Latin America Natural Gas Liquid Market Attractiveness Analysis, by Type
10.5. Latin America Natural Gas Liquid Market Attractiveness Analysis, by Country and Sub-region
11. Middle East Natural Gas Liquid Market Overview
11.1. Key Findings
11.2. Middle East Natural Gas Liquid Market Volume (Thousand B/D) Forecast, by Type, 2018–2027
11.3. Middle East Natural Gas Liquid Market Volume (Thousand B/D) Forecast, by Country and Sub-region, 2018–2027
11.3.1. Qatar Natural Gas Liquid Market Volume (Thousand B/D) Forecast, by Type, 2018–2027
11.3.2. Iran Natural Gas Liquid Market Volume (Thousand B/D) Forecast, by Type, 2018–2027
11.3.3. Saudi Arabia Natural Gas Liquid Market Volume (Thousand B/D) Forecast, by Type, 2018–2027
11.3.4. UAE Natural Gas Liquid Market Volume (Thousand B/D) Forecast, by Type, 2018–2027
11.3.5. Rest of Middle East Natural Gas Liquid Market Volume (Thousand B/D) Forecast, by Type, 2018–2027
11.4. Middle East Natural Gas Liquid Market Attractiveness Analysis, by Type
11.5. Middle East Natural Gas Liquid Market Attractiveness Analysis, by Country and Sub-region
12. Competition Landscape
12.1. Competition Matrix
12.2. Global Natural Gas Liquid Market Share Analysis, by Company (2018)
12.3. Market Footprint Analysis
12.4. Company Profiles
12.4.1. BP Plc.
12.4.1.1. Company Details
12.4.1.2. Company Description
12.4.1.3. Business Overview
12.4.1.4. Financial Details
12.4.1.5. Strategic Overview/Recent Developments
12.4.2. ExxonMobil Corporation
12.4.2.1. Company Details
12.4.2.2. Company Description
12.4.2.3. Business Overview
12.4.2.4. Strategic Overview/Recent Developments
12.4.3. Royal Dutch Shell Plc.
12.4.3.1. Company Details
12.4.3.2. Company Description
12.4.3.3. Business Overview
12.4.3.4. Financial Details
12.4.3.5. Strategic Overview/Recent Developments
12.4.4. Range Resources Corporation
12.4.4.1. Company Details
12.4.4.2. Company Description
12.4.4.3. Business Overview
12.4.4.4. Financial Details
12.4.4.5. Strategic Overview/Recent Developments
12.4.5. SM Energy
12.4.5.1. Company Details
12.4.5.2. Company Description
12.4.5.3. Business Overview
12.4.5.4. Financial Details
12.4.5.5. Strategic Overview/Recent Developments
12.4.6. Equinor ASA
12.4.6.1. Company Details
12.4.6.2. Company Description
12.4.6.3. Business Overview
12.4.6.4. Strategic Overview/Recent Developments
12.4.7. Silver BoW Resources
12.4.7.1. Company Details
12.4.7.2. Company Description
12.4.7.3. Business Overview
12.4.7.4. Financial Details
12.4.7.5. Strategic Overview/Recent Developments
12.4.8. Linn Energy LLC.
12.4.8.1. Company Details
12.4.8.2. Company Description
12.4.8.3. Business Overview
12.4.8.4. Financial Details
12.4.8.5. Strategic Overview/Recent Developments
12.4.9. Occidental Petroleum
12.4.9.1. Company Details
12.4.9.2. Company Description
12.4.9.3. Business Overview
12.4.9.4. Financial Details
12.4.9.5. Strategic Overview/Recent Developments
12.4.10. ConocoPhillips Company
12.4.10.1. Company Details
12.4.10.2. Company Description
12.4.10.3. Business Overview
12.4.11. Cheaspeake Energy Corporation
12.4.11.1. Company Details
12.4.11.2. Company Description
12.4.11.3. Business Overview
12.4.11.4. Strategic Overview/Recent Developments
13. Primary Research – Key Insights
14. Appendix
14.1. Research Methodology and Assumptions
List of Tables
Table 01: Global Natural Gas Liquid Market Volume (Thousand B/D) Forecast, by Type, 2018–2027
Table 02: Global Natural Gas Liquid Market Volume (Thousand B/D) Forecast, by Region, 2018–2027
Table 03: North America Natural Gas Liquid Market Volume (Thousand B/D) Forecast, by Type, 2018–2027
Table 04: North America Natural Gas Liquid Market Volume (Thousand B/D) Forecast, by Country, 2018–2027
Table 05: U.S. Natural Gas Liquid Market Volume (Thousand B/D) Forecast, by Type, 2018–2027
Table 06: Canada Natural Gas Liquid Market Volume (Thousand B/D) Forecast, by Type, 2018–2027
Table 07: Europe Natural Gas Liquid Market Volume (Thousand B/D) Forecast, by Type, 2018–2027
Table 08: Europe Natural Gas Liquid Market Volume (Thousand B/D) Forecast, by Country and Sub-region, 2018–2027
Table 09: Norway Natural Gas Liquid Market Volume (Thousand B/D) Forecast, by Type, 2018–2027
Table 10: Russia Natural Gas Liquid Market Volume (Thousand B/D) Forecast, by Type, 2018–2027
Table 11: U.K. Natural Gas Liquid Market Volume (Thousand B/D) Forecast, by Type, 2018–2027
Table 12: Netherlands Natural Gas Liquid Market Volume (Thousand B/D) Forecast, by Type, 2018–2027
Table 13: Rest of Europe Natural Gas Liquid Market Volume (Thousand B/D) Forecast, by Type, 2018–2027
Table 14: Asia Pacific Natural Gas Liquid Market Volume (Thousand B/D) Forecast, by Type, 2018–2027
Table 15: Asia Pacific Natural Gas Liquid Market Volume (Thousand B/D) Forecast, by Country and Sub-region, 2018–2027
Table 16: Indonesia Natural Gas Liquid Market Volume (Thousand B/D) Forecast, by Type, 2018–2027
Table 17: Australia Natural Gas Liquid Market Volume (Thousand B/D) Forecast, by Type, 2018–2027
Table 18: India Natural Gas Liquid Market Volume (Thousand B/D) Forecast, by Type, 2018–2027
Table 19: Rest of Asia Pacific Natural Gas Liquid Market Volume (Thousand B/D) Forecast, by Type, 2018–2027
Table 20: Africa Natural Gas Liquid Market Volume (Thousand B/D) Forecast, by Type, 2018–2027
Table 21: Africa Natural Gas Liquid Market Volume (Thousand B/D) Forecast, by Country and Sub-region, 2018–2027
Table 22: Algeria Pacific Natural Gas Liquid Market Volume (Thousand B/D) Forecast, by Type, 2018–2027
Table 23: Nigeria Natural Gas Liquid Market Volume (Thousand B/D) Forecast, by Type, 2018–2027
Table 24: Rest of Africa Natural Gas Liquid Market Volume (Thousand B/D) Forecast, by Type, 2018–2027
Table 25: Latin America Natural Gas Liquid Market Volume (Thousand B/D) Forecast, by Type, 2018–2027
Table 26: Latin America Natural Gas Liquid Market Volume (Thousand B/D) Forecast, by Country and Sub-region, 2018–2027
Table 27: Argentina Natural Gas Liquid Market Volume (Thousand B/D) Forecast, by Type, 2018–2027
Table 28: Brazil Natural Gas Liquid Market Volume (Thousand B/D) Forecast, by Type, 2018–2027
Table 29: Venezuela Natural Gas Liquid Market Volume (Thousand B/D) Forecast, by Type, 2018–2027
Table 30: Rest of Latin America Natural Gas Liquid Market Volume (Thousand B/D) Forecast, by Type, 2018–2027
Table 31: Middle East Natural Gas Liquid Market Volume (Thousand B/D) Forecast, by Type, 2018–2027
Table 32: Middle East Natural Gas Liquid Market Volume (Thousand B/D) Forecast, by Country and Sub-region, 2018–2027
Table 33: Qatar Natural Gas Liquid Market Volume (Thousand B/D) Forecast, by Type, 2018–2027
Table 34: Iran Natural Gas Liquid Market Volume (Thousand B/D) Forecast, by Type, 2018–2027
Table 35: Saudi Arabia Natural Gas Liquid Market Volume (Thousand B/D) Forecast, by Type, 2018–2027
Table 36: UAE Natural Gas Liquid Market Volume (Thousand B/D) Forecast, by Type, 2018–2027
Table 37: Rest of Middle East Natural Gas Liquid Market Volume (Thousand B/D) Forecast, by Type, 2018–2027?
List of Figures
Figure 01: Net Sales (US$ Mn) and Y-o-Y Growth (%), 2015–2019
Figure 02: Breakdown of Revenue, by Business Segment, 2018
Figure 03: Net Sales (US$ Mn) and Y-o-Y Growth (%), 2015–2019
Figure 04: Breakdown of Revenue, by Business Segment, 2018
Figure 05: Net Sales (US$ Mn) and Y-o-Y Growth (%), 2015–2018
Figure 06: Breakdown of Revenue, by Business Segment, 2018
Figure 07: Net Sales (US$ Mn) and Y-o-Y Growth (%), 2015–2018
Figure 08: Breakdown of Revenue, by Business Segment, 2018
Figure 09: Net Sales (US$ Mn) and Y-o-Y Growth (%), 2015–2018
Figure 10: Net Sales (US$ Mn) and Y-o-Y Growth (%), 2015–2018
Figure 11: Net Sales (US$ Mn) and Y-o-Y Growth (%), 2015–2018
Copyright © Transparency Market Research, Inc. All Rights reserved
Trust Online


Natural Gas Liquid Market