
The demand within the coal trading market is expected to experience an uptick in the times to follow. Use of coal across the industrial sector has created a plethora of opportunities for growth within the global market. The development of improved supply chains for coal trading has emerged as an important dynamic of market growth. Several industrial units have increased their consumption of coal in recent times. Moreover, new research lines have helped in understanding the advantages of using coal for industrial purposes. Therefore, the total worth of the global coal trading market is set to increase by a dramatic chase in the times to follow.
The phenomenal infrastructural growth across the globe has created a huge demand for energy in several direct and indirect ways. The unprecedented rate of industrialization has also led to a huge need for energy, thereby triggering coal trading activities. An analysis published by Transparency Market Research states that 42% of the overall energy generation can be attributed to coal. Keeping true to this statement, analysts have predicted that coal trading market will stand at 10,951 million tons (MT) by 2023. The coal trading market, by volume, was 8,086 million tons (MT) in 2014. Between 2015 and 2023 the coal trading market is expected to rise at a CAGR of 3.43% in terms of volume.
Coal trading is also going to be facilitated by the fact that it is an exceptionally cheap commodity as compared to natural gas and oil. Its deep reserves also make it is a safe raw material for the production of energy. Furthermore, coal is available abundantly, commonly, and requires low-cost logistics, making it the best possible option for meeting the energy demands of the world. The rise in the coal trading activities is also attributable to the score of coal companies expanding their operations in the near future.
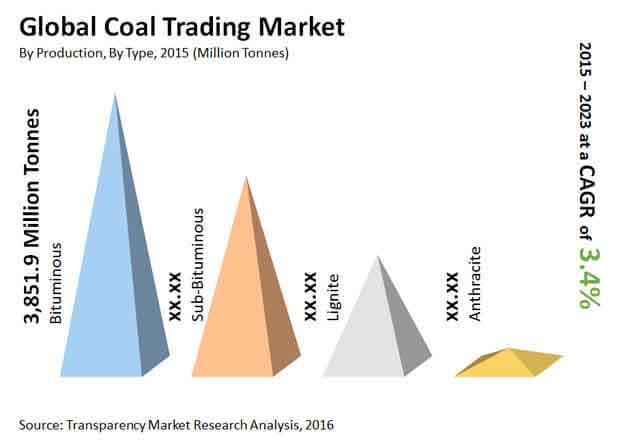
The lignite product segment is anticipated to grow more than the other product segments due to its increasing usage in the iron, power, and steel industries. This growth will be supported by the low cost of production involved in setting up lignite-fired power plants. Furthermore, it also happens to be the most affordable product and has a low calorific value.
The biggest hurdle in the demand for lignite is the transportation challenge due to the high content of moisture present in lignite. However, coal traders are overcoming this obstacle by setting up their power plants close to the mines. With this scenario, the lignite coal product segment is anticipated to expand at 3.04% CAGR in the same forecast period.
Asia Pacific is steering the growth of the coal trading market, fueling its activities with a fast-pace industrialization and a list of ongoing infrastructure projects. Thus, the humungous amount of power required by these elements is largely determining the establishment and expansion of power plants to cater to the electricity demands. The burgeoning economies of China and India are anticipated to keep coal trading activities in top gear due to the ever-increasing population that will demand energy in the coming years.
The players forming the core of the competitive rivalry in the global coal trading market are Arch Coal Inc., PT Adaro Energy Tbk., Coal India Limited, PT Bumi Resources Tbk., Glencore Plc, Siberian Coal Energy Company, China Shenhua Energy Company, BHP Billiton Limited, Anglo American Plc., and , Peabody Energy Corporation. The competition in the overall market is exceptionally stiff due to the presence of a few players. In the coming years, the companies are anticipated to partner with regional players to get easy access to new markets and establish operational stability.
Rising Use of Coal across Industrial Sector will Further Push Coal Trading Market Growth Rate to New Heights
A few researchers highlight the ecological effect of utilizing coal in high volumes. Aside from adding to air contamination, coal producing likewise makes harm other natural parts. This factor has prompted slow development inside the coal trading market in specific districts. In any case, the extraordinary interest for coal across the substance business will keep on driving business sector interest. It involves quality for ventures utilizing coal fuel, and this is a significant driver of market interest.
The interest inside the coal trading market is relied upon to encounter an uptick in the occasions to follow. Utilization of coal across the mechanical area has set out a plenty of open doors for development inside the worldwide market. The advancement of improved stock chains for coal trading has arisen as a significant dynamic of market development. A few modern units have expanded their utilization of coal lately. Besides, new examination lines have helped in understanding the benefits of utilizing coal for mechanical purposes. Thusly, worldwide coal trading market is projected to increment by a sensational pursue in the coming years.
The wonderful infrastructural development across the globe has encouraged a colossal interest for energy in a few immediate and aberrant manners. The extraordinary pace of industrialization has additionally prompted an enormous requirement for energy, along these lines setting off coal trading exercises. An investigation distributed by Transparency Market Research expresses that 42% of the general energy age can be credited to coal.
Coal trading is additionally going to be worked with by the way that it is an incredibly modest item when contrasted with flammable gas and oil. Its profound holds additionally make it is a protected crude material for the creation of energy. Besides, coal is accessible richly, regularly, and requires minimal expense coordinations, making it the most ideal alternative for fulfilling the energy needs of the world. The ascent in the coal trading exercises is likewise inferable from the score of coal organizations growing their tasks soon.
(*Note: Similar segmentation will be provided for each companies mentioned below)
List of Tables
Table 1. Global Coal Trading Market: Snapshot
Table 2. Global Coal Trading Market, Estimates and Forecast, By Coal Type, 2014–2023 (Million Tonnes)
Table 3. North America Coal Trading Market, By Application, By Volume ( Million Tonnes), 2014 and 2023
Table 4. U.S. Coal Trading Market, By Application, By Volume (Million Tonnes) 2014–2023
Table 5. Canada, Coal Trading Market, By Application, By Volume (Million Tonnes) , 2014–2023
Table 6. Mexico, Coal Trading Market, By Application, By Volume (Million Tonnes) , 2014–2023
Table 7. Europe Coal Trading Market, By Application, By Volume ( Million Tonnes), 2014 and 2023
Table 8. Germany, Coal Trading Market, By Application, By Volume (Million Tonnes) , 2014–2023
Table 9. Kazakhstan, Coal Trading Market, By Application, By Volume (Million Tonnes) , 2014–2023
Table 10. Rest of Europe, Coal Trading Market, By Application, By Volume (Million Tonnes) , 2014–2023
Table 11. Asia Pacific Coal Trading Market, By Application, By Volume ( Million Tonnes), 2014 and 2023
Table 12. China, Coal Trading Market, By Application, By Volume (Million Tonnes) , 2014–2023
Table 13. India, Coal Trading, By Application, By Volume (Million Tonnes) , 2014–2023
Table 14. Japan, Coal Trading Market, By Application, By Volume (Million Tonnes) , 2014–2023
Table 15. South Korea, Coal Trading Market, By Application, By Volume (Million Tonnes) , 2014–2023
Table 16. Rest of Asia Pacific, Coal Trading Market, By Application, By Volume (Million Tonnes) , 2014–2023
Table 17. Middle East and Africa (MEA) Coal Trading Market, by Application, By Volume ( Million Tonnes), 2014 and 2023
Table 18. South Africa, Coal Trading Market, By Application, By Volume (Million Tonnes) , 2014–2023
Table 19. Rest of Middle East and Africa (MEA), Coal Trading Market, By Application, By Volume (Million Tonnes) ,2014-2023
Table 20. South and Central America (SCA), Coal Trading Market, by Volume ( Million Tonnes), 2014 and 2023
Table 21. Brazil, Coal Trading Market, By Application, By Volume (Million Tonnes) , 2014–2023
Table 22. Argentina, Coal Trading Market, By Application, By Volume (Million Tonnes) , 2014–2023
Table 23. Rest of South Central America, Coal Trading Market, By Application, By Volume (Million Tonnes) , 2014–2023
List of Figures
Figure 1. Global Coal Trading Market Segmentation
Figure 2. Global Coal Trading Market, By Application, By Volume ( Million Tonnes), 2014-2023
Figure 3. Global Coal Trading Market, By Coal Type, By Volume (Million Tonnes), 2014-2023
Figure 4. Global Coal Trading Market, % Share, By End-users of Coal, 2014
Figure 5. Global Coal Trading Market, % Share, By Carbon Emission of Major Fuels, Post Consumption, 2014
Figure 6. Market Attractiveness Analysis of Coal Trading Market , By Region, 2014
Figure 7. Global Coal Trading Market, Company Market Share (%) (2014)
Figure 8. Global Coal Trading Market , By Coal Type, 2014 and 2023
Figure 9. Global Coal Trading Market, Estimates and Forecast, By Lignite, 2014–2023, By Volume (Million Tonnes)
Figure 10. Global Coal Trading Market, Estimates and Forecast, By Sub-Bituminous, 2014–2023 , By Volume (Million Tonnes)
Figure 11. Global Coal Trading Market, Estimates and Forecast, By Bituminous, 2014–2023, By Volume (Million Tonnes)
Figure 12. Global Coal Trading Market, Estimates and Forecast, By Anthracite, 2014–2023, By Volume (Million Tonnes)
Figure 13. Global Coal Trading Market , By Coal Application, 2014 and 2023
Figure 14. Global Coal Trading Market, Estimates and Forecast, By Power, 2014–2023, By Volume (Million Tonnes)
Figure 15. Global Coal Trading Market, Estimates and Forecast, By Iron & Steel, 2014–2023, By Volume (Million Tonnes)
Figure 16. Global Coal Trading Market, Estimates and Forecast, By Cement, 2014–2023, By Volume (Million Tonnes)
Figure 17. Global Coal Trading Market, Estimates and Forecast, By Others, 2014–2023, By Volume (Million Tonnes)
Figure 18. Global Coal Trading Market Share, by Region, 2014 and 2023
Figure 19. North America Coal Trading Market Share, by Country, 2014 and 2023
Figure 20. Europe Coal Trading Market Share, by Country, 2014 and 2023
Figure 21. Asia Pacific Coal Trading Market Share, by Country, 2014 and 2023
Figure 22. Middle East and Africa Coal Trading Market Share, by Country, 2014 and 2023
Figure 23. South and Central America Coal Trading Market Share, by Country, 2014 and 2023
Figure 24. Arch Coal Inc., Revenue By Business Segment, 2014
Figure 25. Arch Coal Inc., Financial Sales Statistic by Region, 2012-2014
Figure 26. Coal India Limited, Industrial Application of Coal Produced, By % Share, 2014
Figure 27. Coal India Limited, Financial Sales Statistic by Region, 2014
Figure 28. PT Adaro Energy Tbk., Revenue By Business Segment, 2014
Figure 29. PT Adaro Energy Tbk., Revenue by Region, 2014
Figure 30. PT Bumi Resources Tbk., Revenue By Business Segment, 2014
Figure 31. PT Bumi Resources Tbk., Revenue by Region, 2014
Figure 32. China Shenhua Energy Company, Revenue By Business Segment, 2014
Figure 33. China Shenhua Energy Company, Revenue by Region, 2014
Figure 34. Glencore Plc., Revenue By Business Segment, 2014
Figure 35. Glencore Plc.,, Revenue by Region, 2014
Figure 36. Siberian Coal Energy Company, Revenue By Business Segment, 2014
Figure 37. Siberian Coal Energy Company, Revenue by Region, 2014
Figure 38. BHP Billiton Limited, Revenue By Business Segment, 2014
Figure 39. BHP Billiton Limited, Revenue by Region, 2014
Figure 40. Peabody Energy Corporation, Revenue By Business Segment, 2014
Figure 41. Peabody Energy Corporation, Revenue by Region, 2014
Figure 42. Anglo American Plc, Revenue By Business Segment, 2014
Figure 43. Anglo American Plc, Revenue by Region, 2010–2014
Copyright © Transparency Market Research, Inc. All Rights reserved
Trust Online


Coal Trading Market