
Complex Fertilizers Market by Type (Incomplete, Complete), Crop Type (Cereals, Oilseeds, Fruits & Vegetables), Form (Solid, Liquid), and Region (North America, Europe, Asia-Pacific, South America, and Rest of the World) - Forecast to 2022
Market Segmentation
| Report Metrics | Details |
|
Market size available for years |
2017 - 2022 |
|
CAGR % |
6.5 |
Top 10 companies in Complex Fertilizers Market
Complex Fertilizers Market News
| Publish Date | Complex Fertilizers Market Updates |
|---|---|
| 13-Mar-2024 | EuroChem launches state-of-the-art phosphate fertilizer complex in Brazil |


[148 Pages Report] The complex fertilizers market was valued at USD 44.03 Billion in 2016; it is projected to grow at a CAGR of 6.5% from 2017, to reach a projected value of USD 54.32 Billion by 2022. In this report, the size of the overall complex fertilizers market was derived using forecasting techniques based on the consumption of fertilizers and trade trends in various regions. The segmentation of the market in this report is based on type, crop type, form, and region.
In order to complete the overall market engineering process and arrive at the exact statistics for all segments and subsegments, the data triangulation and market breakdown procedures were employed wherever applicable. The data was triangulated by studying various factors and trends from the demand and supply sides. Along with this, the market size was validated using the top-down and the bottom-up approaches.
The report includes all possible parameters that affect the markets covered in this research study, which have been accounted for, viewed in extensive detail, verified through primary research, and analyzed to obtain the final quantitative and qualitative data. The figure below shows the breakdown of profiles of industry experts that participated in the primary discussions.
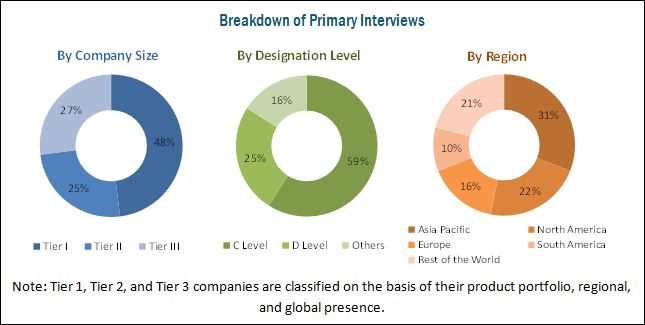
To know about the assumptions considered for the study, download the pdf brochure
The key players that have been profiled in this report include CF Industries Holdings Inc. (US), Yara International ASA (Norway), The Mosaic Company (US), EuroChem Group AG (Switzerland), Potash Corporation of Saskatchewan (Canada), PhosAgro (Russia), Agrium Inc. (Canada), Israel Chemicals Limited (Israel), Sociedad Qu�mica y Minera de Chile (Chile), Haifa Chemicals Ltd., (Israel), Helena Chemical Company (US), and Zuari Agro Chemicals Ltd (India).
This report is targeted at the following existing players in the industry:
- Complex fertilizer manufacturers
- Complex fertilizer importers and exporters
- Complex fertilizer traders, distributors, and suppliers
- Government and research organizations
- Commercial research & development (R&D) institutions and financial institutions
�The study answers several questions for stakeholders, primarily which market segments to focus on in next two to five years for prioritizing efforts and investments.�
Get online access to the report on the World's First Market Intelligence Cloud
Request Sample Scope of the Report

On the basis of Type, the complex fertilizers market has been segmented as follows:
- Incomplete
- Diammonium phosphate
- Monoammonium phosphate
- Mono potassium phosphate
- Potassium nitrate
- Others (nitro phosphate and urea phosphate)
- Complete
- NPK (10-26-26)
- NPK.(12-32-16)
- NPK.(15-15-15)
- Other NPK compounds
On the basis of Crop Type, the complex fertilizers market has been segmented as follows:
- Cereals
- Oilseeds
- Fruits & vegetables
- Others (turf & ornamentals, plantation crops, fiber crops, and silage & forage crops)
On the basis of Form, the complex fertilizers market has been segmented as follows:
- Solid
- Liquid
On the basis of Region, the complex fertilizers market has been segmented as follows:
- North America
- Europe
- Asia-Pacific
- South America
- Rest of the World (RoW)
Available Customizations
With the given market data, MarketsandMarkets offers customizations according to the company�s specific scientific needs.
The following customization options are available for the report:
Product Analysis
- Product matrix, which gives a detailed comparison of the product portfolio of each company
Geographic Analysis
- Further breakdown of the Rest of Europe complex fertilizers market into the Spain, Italy, the Netherlands, Ukraine, Finland, Ireland, Greece, Austria, and Denmark
- Further breakdown of the Rest of Asia Pacific market into Indonesia, Bangladesh, and Vietnam
- Further breakdown of the Rest of South American complex fertilizers market into Chile, Colombia, Bolivia, Venezuela, and Peru
Company Information
- Detailed analyses and profiling of additional market players (up to five)
The complex fertilizers market is projected to grow at a CAGR of 6.5% from 2017, to reach a projected value of USD 54.32 Billion by 2022. Both demand and supply of compound fertilizers are expected to witness tremendous growth in 2017, and both are expected to grow steadily in the future. Increased demand for NPK gives fertilizer producers the challenge of finding the most cost-effective solutions to diversify their range of products with the possibility of adapting to the changing market trends and the requirements of their customers.
It is estimated that in the next 20 years, the global demand for food and energy will increase by more than 50%; this rise in food demand calls for the use of fertilizers to help enhance agricultural productivity and increase yield, thus driving the market of complex fertilizers. The usage of complex fertilizers in horticulture crops is gradually increasing, as these crops have high demand across the world. Increase in environmental degradation and population is reducing the area of productive land under cultivation, giving rise to the development of fertilizer solutions to sustain this increasing demand for horticultural crops.
Complex fertilizers have better physical, chemical, and mechanical properties compared to regular fertilizers. They offer a wider variety of options and can be customized to satisfy demand in accordance with specific soil compositions. Complex fertilizers are nutrient specific. Thus, for supplying a particular nutrient, one can select a specific chemical fertilizer. On the basis of form, the complex fertilizers market is segmented into solid and liquid fertilizers. The solid segment accounted for more than half of the total form market in 2016. Since it is a low-cost technique compared to the other techniques (such as fertigation), it is economical to use it on low-cost cereals such as wheat and corn, which are the major crop types dominating the complex fertilizers market.
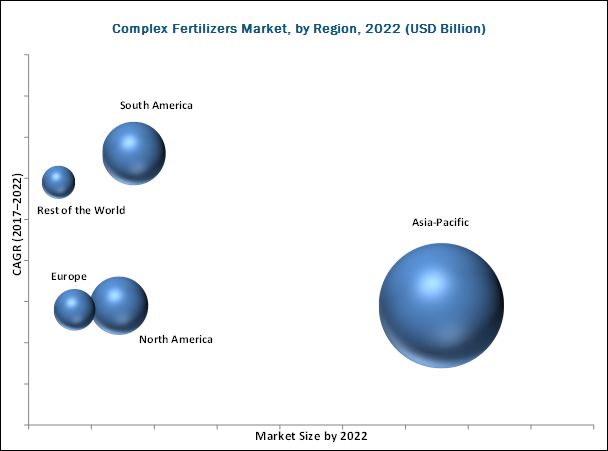
The Asia Pacific region is the largest consumer of complex fertilizers. The region is mainly dominated by large-scale operations, with an organized distribution chain. Asia Pacific is largely consists of marginal farmers practicing conventional farming methods. The South American market is projected to grow at the highest CAGR during the forecast period, owing to the increase in awareness about the modern agricultural practices. The growth in demand for food is also driving the market; the growth is mainly witnessed in Brazil and Argentina, owing to the rise in awareness and adoption of modern agricultural practices.
The African continent has the lowest fertilizer consumption in the world. However, the situation is changing rapidly in some leading countries that are experiencing an economic and population growth, which fuel food demand and production.
The rise in awareness about health and wellness, growth of the organic food industry, and the significant increase in the price of chemicals have played a huge role in providing the necessary boost to the global biofertilizers industry, which acts as a restraint for the complex fertilizers market.
The uncertainty in prices leads to challenges in production planning and sourcing of raw materials. The cost of ammonia has also been volatile due to lower natural gas costs, which further affects the price of complex fertilizers. Therefore, the fluctuation in the prices of raw materials is a direct challenge that the manufacturers of complex fertilizers need to combat.
Visionary leaders primarily focus on acquiring the leading market position through their strong financial capabilities and well-established brand equity. Innovators are players that have a strong focus on innovation and invest heavily in R&D and new product launches. These players hold specific patents in the core market and launch products to gain competitive advantage. Yara International ASA (Norway), Israel Chemicals Ltd. (Israel), Potash Corporation of Saskatchewan Inc. (Canada), Agrium Inc. (Canada), PhosAgro (Russia), CF Industries Holdings, Inc. (US), and The Mosaic Company (US) are the key players in the complex fertilizers market.
To speak to our analyst for a discussion on the above findings, click Speak to Analyst
Table of Contents
1 Introduction (Page No. - 14)
1.1 Objectives of the Study
1.2 Market Definition
1.3 Study Scope
1.4 Years Considered
1.5 Currency Considered
1.6 Units Considered
1.7 Stakeholders
2 Research Methodology (Page No. - 18)
2.1 Research Data
2.1.1 Secondary Data
2.1.2 Primary Data
2.1.2.1 Breakdown of Primaries
2.1.2.2 Key Industry Insights
2.2 Market Breakdown & Data Triangulation
2.3 Market Size Estimation
2.3.1 Bottom-Up Approach
2.3.2 Top-Down Approach
2.4 Research Assumptions & Limitations
2.4.1 Assumptions
2.4.2 Limitations
3 Executive Summary (Page No. - 25)
4 Premium Insights (Page No. - 29)
4.1 Attractive Opportunities in the Complex Fertilizers Market
4.2 Complex Fertilizers Market, By Form
4.3 Asia-Pacific Complex Fertilizers Market, By Country & Crop Type
4.4 Market, By Type
4.5 Market: Market Share of Top Countries
5 Market Overview (Page No. - 32)
5.1 Introduction
5.2 Macro Indicators
5.2.1 Increasing World Population and Food Requirement
5.2.2 Limited Arable Land
5.3 Market Dynamics
5.3.1 Market Drivers
5.3.1.1 Better Physical & Chemical Properties
5.3.1.2 Rapid Growth in Greenhouse Production
5.3.1.3 Increasing Crop Demand for Biofuel
5.3.1.4 Increasing Crop Demand for Animal Feed
5.3.2 Restraints
5.3.2.1 Growth of the Organic Fertilizers Industry
5.3.2.2 Depressed Commodity Prices and Lower Farm Incomes
5.3.3 Opportunities
5.3.3.1 Strong Progress in New & Emerging Markets
5.3.3.2 Growing Market for Fruits & Vegetables
5.3.4 Challenges
5.3.4.1 Fluctuations in Raw Material Prices
5.3.4.2 Unfavorable Regulatory Stance
5.4 Industry Trends
5.4.1 Value Chain Analysis
5.4.2 Supply Chain Analysis
6 Complex Fertilizers Market, By Type (Page No. - 42)
6.1 Introduction
6.2 Incomplete Complex Fertilizers
6.2.1 Diammonium Phosphate
6.2.2 Monoammonium Phosphate
6.2.3 Monopotassium Phosphate
6.2.4 Potassium Nitrate
6.3 Complete Complex Fertilizers
6.3.1 N.P.K (10-26-26)
6.3.2 N.P.K. (12-32-16)
6.3.3 N.P.K. (15-15-15)
7 Complex Fertilizers Market, By Crop Type (Page No. - 47)
7.1 Introduction
7.2 Cereals
7.2.1 Corn
7.2.2 Wheat
7.2.3 Rice
7.2.4 Others
7.3 Oilseeds
7.3.1 Soybean
7.3.2 Canola
7.3.3 Others
7.4 Fruits & Vegetables
7.5 Other Crop Types
8 Complex Fertilizers Market, By Form (Page No. - 54)
8.1 Introduction
8.2 Solid
8.3 Liquid
9 Complex Fertilizers Market, By Region (Page No. - 57)
9.1 Introduction
9.2 North America
9.2.1 U.S.
9.2.2 Canada
9.2.3 Mexico
9.3 Europe
9.3.1 France
9.3.2 Germany
9.3.3 Poland
9.3.4 Spain
9.3.5 Rest of Europe
9.4 Asia-Pacific
9.4.1 China
9.4.2 India
9.4.3 Japan
9.4.4 Australia
9.4.5 Rest of Asia-Pacific
9.5 South America
9.5.1 Brazil
9.5.2 Argentina
9.5.3 Rest of South America
9.6 Rest of the World (RoW)
9.6.1 South Africa
9.6.2 Turkey
9.6.3 Others in RoW
10 Competitive Landscape (Page No. - 93)
10.1 Introduction
10.2 Competitive Leadership Mapping
10.2.1 Visionary Leaders
10.2.2 Dynamic Differentiators
10.2.3 Innovators
10.2.4 Emerging Companies
10.3 Competitive Benchmarking
10.3.1 Strength of Product Portfolio
10.3.2 Business Strategy Excellence
10.4 Market Share Analysis
*Top 25 Companies Analyzed for This Study are - Acron (Russia), Agrium Inc. (Canada), Azomures (Romania), CF Industries Holdings, Inc. (U.S.), Coromandel International Limited (India), Eurochem Group AG (Switzerland), Gujarat State Fertilizers & Chemicals (India), Haifa Chemicals Ltd. (Israel), Hebei Monband Water Soluble Fertilizer Co., Ltd. (China), Helena Chemical Company (U.S.), Helm AG (Germany), Indian Farmers Fertilizer Cooperative Limited (India), Israel Chemicals Ltd. (Israel), J.R. Simplot Company (U.S.), Kugler Company (U.S.), Ocp S.A. (Morocco), Phosagro (Russia), Potash Corporation of Saskatchewan Inc. (Canada), Rashtriya Chemicals & Fertilizers Ltd. (India), Sabic (Saudi Arabia), Sociedad Qu�mica Y Minera De Chile SA (Chile), the Mosaic Company (U.S.), Wengfu Group (China), Yara International ASA (Norway), Zuari Agro Chemicals Ltd. (India)
11 Company Profiles (Page No. - 98)
(Business Overview, Strength of Product Portfolio, Products Offered, Business Strategy Excellence, Recent Developments)*
11.1 Agrium Inc.
11.2 CF Industries Holdings, Inc
11.3 Coromandel International Ltd.
11.4 Eurochem Group AG
11.5 Haifa Chemicals Ltd.
11.6 Helena Chemical Company
11.7 Israel Chemicals Limited
11.8 Phosagro
11.9 Potash Corporation of Saskatchewan Inc.
11.10 Sociedad Qu�mica Y Minera De Chile SA
11.11 The Mosaic Company
11.12 Yara International ASA
11.13 Zuari Agro Chemicals Ltd.
*Details on Business Overview, Strength of Product Portfolio, Products Offered, Business Strategy Excellence, Recent Developments Might Not Be Captured in Case of Unlisted Companies.
12 Appendix (Page No. - 140)
12.1 Discussion Guide
12.2 Knowledge Store: Marketsandmarkets� Subscription Portal
12.3 Introducing RT: Real-Time Market Intelligence
12.4 Available Customizations
12.5 Related Reports
12.6 Author Details
List of Tables (81 Tables)
Table 1 World Protein Production, Fao Forecast Until 2050 (Million Metric Tons)
Table 2 Complex Fertilizers Market Size, By Type, 2015-2022 (Thousand Tons)
Table 3 Incomplete Complex Fertilizers Market Size, By Region, 2015�2022 (Thousand Tons)
Table 4 Incomplete Complex Fertilizers Market Size, By Type, 2015�2022 (Thousand Tons)
Table 5 Complete Complex Fertilizers Market Size, By Region, 2015�2022 (Thousand Tons)
Table 6 Complete Complex Fertilizers Market, By Type, 2015�2022 (Thousand Tons)
Table 7 Complex Fertilizers Market Size, By Crop Type, 2015�2022 (Thousand Tons)
Table 8 Complex Fertilizers for Cereals Market Size, By Region, 2015�2022 (Thousand Tons)
Table 9 Market Size for Cereals, By Type, 2015�2022 (Thousand Tons)
Table 10 Complex Fertilizers for Oilseeds Market Size, By Region, 2015�2022 (Thousand Tons)
Table 11 Complex Fertilizers for Oilseeds Market Size, By Type, 2015�2022 (Thousand Tons)
Table 12 Complex Fertilizers for Fruits & Vegetables Market Size, By Region, 2015�2022 (Thousand Tons)
Table 13 Complex Fertilizers for Other Crop Types Market Size, By Region, 2015�2022 (Thousand Tons)
Table 14 Complex Fertilizers Market Size, By Form, 2015�2022 (Thousand Tons)
Table 15 Solid Complex Fertilizers Market Size, By Region, 2015�2022 (Thousand Tons)
Table 16 Liquid Complex Fertilizers Market Size, By Region, 2015�2022 (Thousand Tons)
Table 17 Complex Fertilizers Market Size, By Region, 2015�2022 (USD Million)
Table 18 Market Size, By Region, 2015�2022 (Thousand Tons)
Table 19 North America: Complex Fertilizers Market Size, By Country, 2015�2022 (USD Million)
Table 20 North America: Market Size, By Country, 2015�2022 (Thousand Tons)
Table 21 North America: Market Size, By Type, 2015�2022 (Thousand Tons)
Table 22 North America: Incomplete Complex Fertilizers Market Size, By Type, 2015�2022 (Thousand Tons)
Table 23 North America: Complex Fertilizers Market Size, By Crop Type, 2015�2022 (Thousand Tons)
Table 24 North America: Market Size, By Form, 2015�2022 (Thousand Tons)
Table 25 U.S.: Market Size, By Crop Type, 2015�2022 (Thousand Tons)
Table 26 Canada: Market Size, By Crop Type, 2015�2022 (Thousand Tons)
Table 27 Mexico: Market Size, By Crop Type, 2015�2022 (Thousand Tons)
Table 28 Europe: Complex Fertilizers Market Size, By Country, 2015�2022 (USD Million)
Table 29 Europe: Market Size, By Country, 2015�2022 (Thousand Tons)
Table 30 Europe: Market Size, By Type, 2015�2022 (Thousand Tons)
Table 31 Europe: Incomplete Complex Fertilizers Market Size, By Type, 2015�2022 (Thousand Tons)
Table 32 Europe: Complex Fertilizers Market Size, By Crop Type, 2015�2022 (Thousand Tons)
Table 33 Europe: Market Size, By Form, 2015�2022 (Thousand Tons)
Table 34 France: Market Size, By Crop Type, 2015�2022 (Thousand Tons)
Table 35 Germany: Market Size, By Crop Type, 2015�2022 (Thousand Tons)
Table 36 Poland: Market Size, By Crop Type, 2015�2022 (Thousand Tons)
Table 37 Spain: Market Size, By Crop Type, 2015�2022 (Thousand Tons)
Table 38 Rest of Europe: Market Size, By Crop Type, 2015�2022 (Thousand Tons)
Table 39 Key Crops Cultivated, By Country/Region
Table 40 Asia-Pacific: Complex Fertilizers Market Size, By Country, 2015-2022 (USD Million)
Table 41 Asia-Pacific: Market Size, By Country, 2015-2022 (Thousand Tons)
Table 42 Asia-Pacific: Market Size, By Type, 2015�2022 (Thousand Tons)
Table 43 Asia-Pacific: Incomplete Complex Fertilizers Market Size, By Type, 2015�2022 (Thousand Tons)
Table 44 Asia-Pacific: Complex Fertilizers Market Size, By Crop Type, 2015-2022 (Thousand Tons)
Table 45 Asia-Pacific: Market Size, By Form, 2015�2022 (Thousand Tons)
Table 46 China: Market Size, By Crop Type, 2015-2022 (Thousand Tons)
Table 47 India: Market Size, By Crop Type, 2015-2022 (Thousand Tons)
Table 48 Japan: Market Size, By Crop Type, 2015-2022 (Thousand Tons)
Table 49 Australia: Market Size, By Crop Type, 2015-2022 (Thousand Tons)
Table 50 Rest of Asia-Pacific: Complex Fertilizers Market Size, By Crop Type, 2015-2022 (Thousand Tons)
Table 51 South America: Market Size, By Country, 2015�2022 (USD Million)
Table 52 South America: Market Size, By Country, 2015�2022 (Thousand Tons)
Table 53 South America: Market Size, By Type, 2015�2022 (Thousand Tons)
Table 54 South America: Incomplete Complex Fertilizers Market Size, By Type, 2015�2022 (Thousand Tons)
Table 55 South America: Complex Fertilizers Market Size, By Crop Type, 2015�2022 (Thousand Tons)
Table 56 South America: Market Size, By Form, 2015�2022 (Thousand Tons)
Table 57 Brazil: Market Size, By Crop Type, 2015�2022 (Thousand Tons)
Table 58 Argentina: Market Size, By Crop Type, 2015�2022 (Thousand Tons)
Table 59 Rest of South America: Market Size, By Crop Type, 2015�2022 (Thousand Tons)
Table 60 RoW: Market Size, By Country, 2015�2022 (USD Million)
Table 61 RoW: Market Size, By Country, 2015�2022 (Thousand Tons)
Table 62 RoW: Complex Fertilizers Market Size, By Type, 2015�2022 (Thousand Tons)
Table 63 Rest of the World: Incomplete Complex Fertilizers Market Size, By Type, 2015�2022 (Thousand Tons)
Table 64 RoW: Complex Fertilizers Market Size, By Crop Type, 2015�2022 (Thousand Tons)
Table 65 RoW: Market Size, By Form, 2015�2022 (Thousand Tons)
Table 66 South Africa: Complex Fertilizers Market Size, By Crop Type, 2015�2022 (Thousand Tons)
Table 67 Turkey: Market Size, By Crop Type, 2015�2022 (Thousand Tons)
Table 68 Others in RoW: Market Size, By Crop Type, 2015�2022 (Thousand Tons)
Table 69 Agrium Inc.: Products Offered
Table 70 CF Industries Holdings, Inc.: Products Offered
Table 71 Coromandel International Ltd: Products Offered
Table 72 Eurochem Group AG: Products Offered
Table 73 Haifa Chemicals Ltd.: Products Offered
Table 74 Helena Chemical Company: Products Offered
Table 75 Israel Chemicals Limited: Products Offered
Table 76 Phosagro : Products Offered
Table 77 Potash Corporation of Saskatchewan Inc.: Products Offered
Table 78 Sociedad Qu�mica Y Minera De Chile SA: Products Offered
Table 79 The Mosaic Company: Products Offered
Table 80 Yara International ASA: Products Offered
Table 81 Zuari Agro Chemicals Limited: Products Offered
List of Figures (41 Figures)
Figure 1 Complex Fertilizers Market Segmentation
Figure 2 Geographic Scope
Figure 3 Complex Fertilizers Market: Research Design
Figure 4 Breakdown of Primary Interviews: By Company Type, Designation, and Region
Figure 5 Data Triangulation
Figure 6 Market Size Estimation Methodology: Bottom-Up Approach
Figure 7 Market Size Estimation Methodology: Top-Down Approach
Figure 8 Oilseeds Segment Projected to Be the Fastest-Growing During the Forecast Period (2017-2022)
Figure 9 Incomplete Complex Fertilizers Segment: Most Attractive for Investments in 2016
Figure 10 Diammonium Phosphate Incomplete Complex Fertilizers Segment Projected to Account for the Largest Share (2017-2022)
Figure 11 Complex Fertilizers Market: Solid Segment to Be the Most Widely Used From 2017 to 2022
Figure 12 South America Projected to Register the Highest Growth Rate, 2017�2022
Figure 13 Asia-Pacific and South America to Offer Opportunities for Growth in the Market During the Forecast Period
Figure 14 Solid Segment to Dominate the Market Throughout the Forecast Period
Figure 15 Cereals Accounted for the Largest Share in the Asia-Pacific Complex Fertilizers Market in 2016
Figure 16 Incomplete Complex Fertilizers to Dominate the Market in 2017
Figure 17 China Dominated the Market in 2016
Figure 18 Global Population Projected to Reach ~9.5 Billion By 2050
Figure 19 Annual Available Arable Land, 1950�2020 (Hectares/Person)
Figure 20 Complex Fertilizers Market: Drivers, Restraints, Opportunities, and Challenges
Figure 21 Bioethanol to Dominate the Biofuels Market
Figure 22 U.S. Commodity Price for Crop Production and Net Farm Income, 2010-2017 (USD Billion)
Figure 23 Value Chain Analysis: Complex Fertilizers Market
Figure 24 Supply Chain: Complex Fertilizers Market
Figure 25 North America Complex Fertilizers Market Snapshot
Figure 26 European Complex Fertilizers Market Snapshot
Figure 27 Asia-Pacific Market Snapshot
Figure 28 South America: Market Snapshot
Figure 29 Complex Fertilizers Market: Competitive Leadership Mapping, 2016
Figure 30 Market: Market Share, 2016
Figure 31 Agrium Inc.: Company Snapshot
Figure 32 CF Industries Holdings, Inc.: Company Snapshot
Figure 33 Coromandel International Ltd.: Company Snapshot
Figure 34 Eurochem Group AG: Company Snapshot
Figure 35 Israel Chemicals Limited: Company Snapshot
Figure 36 Phosagro : Company Snapshot
Figure 37 Potash Corporation of Saskatchewan Inc.: Company Snapshot
Figure 38 Sociedad Qu�mica Y Minera De Chile SA: Company Snapshot
Figure 39 The Mosaic Company: Company Snapshot
Figure 40 Yara International ASA: Company Snapshot
Figure 41 Zuari Agro Chemicals Limited: Company Snapshot


Growth opportunities and latent adjacency in Complex Fertilizers Market