
Tokenization Market - Snapshot
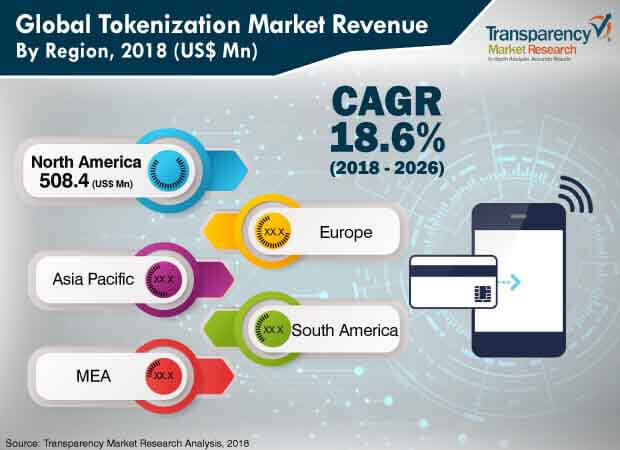
Tokenization is a data security system which converts sensitive data into a unique ID, referred to as token, to avoid unauthorized access to sensitive information. This process then preserves all the information in a format that allows the information’s security not to be compromised. Tokenization is beneficial for enterprises as it makes it difficult for individuals to hack the system or breach security, to gain access to user data. The advantages of tokenization include the ability to secure sensitive data, reduced data loss, reduced payment card industry data security standard (PCI-DSS) compliance scope, compatibility with other technologies, and overall internal protection. The market for tokenization is forecasted to grow to US$ 6,901.1 Mn by 2026, recording a CAGR of 18.6%.
The major factor responsible for growth of the tokenization market is rising data security concerns in all the data sensitive companies around the world. The tokenization market has experienced considerable growth due to large number of financial firms opting for increasing security in payment processing systems. With increasing credit card fraudulent activities, there is a rise in demand for payment security. Tokenization is often used for credit card processing. The payment card industry (PCI) council describes tokenization as a method in which the primary account number (PAN) is substituted with a surrogate/alternate value called a token.
The tokenization market is driven by the increase in cyberattacks and data breaches. This in turn is boosting the tokenization sector globally. For instance, in May 2017, cyberattacks by the WannaCry ransomware struck several banks, financial institutions, and hospitals. More than 200,000 computers around the world were hacked due to these attacks. Many such cyberattacks have raised concerns about data security. Moreover, they have boosted the demand for security solutions (such as tokenization) even in small and medium enterprises (SMEs). The global tokenization market is anticipated to grow significantly during the forecast period, attributed to rapidly growing demand for market surveillance.
However, high cost of implementation and upgrade of hardware required for tokenization is expected to be one of the major restraints pulling back the market growth. The cost of hardware (storage and security), software (synchronization & replication), and technical support required to maintain in-house tokenization is a major concern for organizations, particularly small- and medium-sized organizations and enterprises.
The tokenization market is segmented on the basis of components, solution, enterprise size, and end-use. Based on components, the market has been segmented into hardware, software (on- premise, cloud) and services (managed/outsourced services, professional services). Based on solution, the market has been segmented into payment security, customer data management, compliance & policy management, omni-channel management, and encryption. Payment security solution held the major share in 2016 in the overall tokenization market. However, compliance & policy management, and omni-channel management are expected to display comparatively fast growth during the forecast period. On the basis of enterprise size, the market has been divided as small & medium enterprise and large enterprise. In terms of end-use, the market has been bifurcated into BFSI, retail & consumer goods, government, education, military & defense, automotive, IT & telecom, energy & utilities, manufacturing, and others (hospitality & transportation).
From a geographical standpoint, North America is expected to hold a major share in the tokenization market. Growth in this region is attributed to strong adoption and penetration of tokenization software, hardware and services, as well as considerable application of tokenization in different end-user segments across the region. Asia Pacific region is expected to witness lucrative growth due to rising adoption of such software in India, Japan, Philippines, and Singapore. Furthermore, the markets in Middle East & Africa (MEA) and South America are also expected to grow significantly during the forecast period.
Attracted by this fast technological advancements and rising spending on cybersecurity, many players are driven to develop comprehensive security suites comprised of hardware (HSM), and software. Some of the key players profiled in the tokenization market report include Gemalto NV, Futurex, Thales e-Security, Inc., CipherCloud, Inc., Symantec Corporation, Hewlett Packard Enterprise Development L.P., Protegrity USA, Inc., TokenEx, First Data Corporation, and CyberSource Corporation
Tokenization Market Reaps Consistent Revenues from Payment Card Industry
Tokenization is gathering momentum for protecting sensitive data, usually text data, in financial and banking services businesses. The credit card industry has made giant strides, on the back of aggressive marketing and transformation in the spending habits of people. Tokenization is viewed as a type of encryption, usually easier to implement than the latter. Efforts by the credit card companies to achieve stringent compliance with PCI-DSS requirements is a key trend bolstering the expansion of the tokenization market. A number of algorithms have come to the fore that have propelled advances in the tokenization market. Concomitant advances have been made in the use of cryptographic algorithms in the banking sector. The sector itself has made rapid strides in the use of IT over the years, both in developed as well as emerging economies. Growing focus on combating credit card frauds and several other frauds have boosted the growth prospects in the tokenization market. Companies in the ecosystem are showing keen market demand for encryption techniques that can ease their data protection frameworks and also help build consumer trust. A few new approaches have come to the fore in relation to out of vocabulary (OOV) words.
The emerging COVID-19 pandemic and the several outbreaks across the world have challenged the conventional business models and firm production systems. The prolonged lockdowns, restrictions of cross-border trade, and severe restrictions on movement of people have led to large morbidity on health on one hand, while disruption the economic systems of even the most advanced nations on the other. Businesses from across numerous industries had to face the brunt of a number supply chain bottlenecks and firm production slump, especially in 2020. The emerging mutant variant in 2021 continues to wreak havoc in some countries, with the likely snowball effect on the entire world economic systems in next few months. Globally, these impacts will also challenge the business models of various players in the tokenization market, whose extent of impact is likely to be ascertained in the coming months.
The tokenization market has been segmented as below:
|
Component |
|
|
Solution |
|
|
Enterprise Size |
|
|
End-use |
|
|
Geographic |
|
1. Preface
1.1. Market Scope
1.2. Market Segmentation
1.3. Key Research Objectives
2. Assumptions and Research Methodology
2.1. Market Taxonomy - Segment Definitions
2.2. Research Methodology
2.2.1. List of Primary and Secondary Sources
2.3. Key Assumptions for Data Modelling
3. Executive Summary : Global Tokenization Market
4. Market Overview
4.1. Introduction
4.2. Global Market – Macro Economic Factors Overview
4.2.1. World GDP Indicator – For Top 20 Economies
4.2.2. Global ICT Spending (US$ Mn), 2012, 2018, 2026
4.2.3. Key Regional Socio-Political-Technological Developments and Their Impact Considerations
4.3. Technology/Product Roadmap
4.4. Market Dynamics (Growth Influencers)
4.4.1. Drivers
4.4.2. Restraints
4.4.3. Opportunities
4.5. Global Tokenization Market Analysis and Forecast, 2012 - 2026
4.5.1. Market Revenue Analysis (US$ Mn)
4.5.1.1. Historic Growth Trends, 2012-2017
4.5.1.2. Forecast Trends, 2018-2026
4.6. Market Attractiveness Analysis – By Region/Country (Global/North America/Europe/Asia Pacific/Middle East & Africa/South America)
4.6.1. By Region/Country
4.6.2. By Component
4.6.3. By End-use
4.6.4. By Enterprise Size
4.6.5. By Solution
4.7. Market Outlook
4.8. Adoption of Tokenization, By Application (%)
4.8.1. Authentication
4.8.2. Encryption
4.8.3. Key Management
4.8.4. Token Storage
4.8.5. Compliance Management
4.9. Pricing Trend Analysis
4.10. Competitive Scenario and Trends
4.10.1. Tokenization Market Concentration Rate
4.10.1.1. List of New Entrants
4.10.2. Mergers & Acquisitions, Expansions
5. Global Tokenization Market Analysis and Forecast, By Component
5.1. Overview & Definitions
5.2. Tokenization Market Size (US$ Mn) Forecast, By Component, 2016 - 2026
5.2.1. Hardware
5.2.2. Software
5.2.2.1. On-Premise
5.2.2.2. Cloud
5.2.3. Services
5.2.3.1. Managed
5.2.3.2. Professional
6. Global Tokenization Market Analysis and Forecast, By Enterprise Size
6.1. Overview & Definitions
6.2. Tokenization Market Size (US$ Mn) Forecast, By Enterprise Size, 2016 - 2026
6.2.1. Large Enterprise
6.2.2. Small & Medium Enterprise
7. Global Tokenization Market Analysis and Forecast, By End-use
7.1. Overview
7.2. Tokenization Market Size (US$ Mn) Forecast, By End-use, 2016 - 2026
7.2.1. BFSI
7.2.2. Retail & Consumer Goods
7.2.3. Government
7.2.4. Education
7.2.5. Military & Defense
7.2.6. Automotive
7.2.7. IT and Telecom
7.2.8. Energy and Utilities
7.2.9. Manufacturing
7.2.10. Others (Hospitality, Transportation etc.)
8. Global Tokenization Market Analysis and Forecast, By Solution
8.1. Overview & Definitions
8.2. Tokenization Market Size (US$ Mn) Forecast, By Solution, 2016 - 2026
8.2.1. Payment Security
8.2.2. Customer Data Management
8.2.3. Compliance and Policy Management
8.2.4. Omni-channel management (Shopping Cart, Retail Devices, POS System, Payment Plugins)
8.2.5. Encryption
9. Global Tokenization Market Analysis and Forecast, by Region
9.1. Overview
9.2. Tokenization Market Size (US$ Mn) Forecast, by Region, 2016 - 2026
9.2.1. North America
9.2.2. Europe
9.2.3. Asia Pacific
9.2.4. Middle East & Africa
9.2.5. South America
10. North America Tokenization Market Analysis and Forecast
10.1. Key Findings
10.2. Tokenization Market Size (US$ Mn) Forecast, By Component, 2016 - 2026
10.2.1. Hardware
10.2.2. Software
10.2.2.1. On-Premise
10.2.2.2. Cloud
10.2.3. Services
10.2.3.1. Managed
10.2.3.2. Professional
10.3. Tokenization Market Size (US$ Mn) Forecast, By Enterprise Size, 2016 - 2026
10.3.1. Large Enterprise
10.3.2. Small & Medium Enterprise
10.4. Tokenization Market Size (US$ Mn) Forecast, By End-use, 2016 - 2026
10.4.1. BFSI
10.4.2. Retail & Consumer Goods
10.4.3. Government
10.4.4. Education
10.4.5. Military & Defense
10.4.6. Automotive
10.4.7. IT and Telecom
10.4.8. Energy and Utilities
10.4.9. Manufacturing
10.4.10. Others (Hospitality, Transportation etc.)
10.5. Tokenization Market Size (US$ Mn) Forecast, By Solution, 2016 - 2026
10.5.1. Payment Security
10.5.2. Customer Data Management
10.5.3. Compliance and Policy Management
10.5.4. Omni-channel management (Shopping Cart, Retail Devices, POS System, Payment Plugins)
10.5.5. Encryption
10.6. Tokenization Market Size (US$ Mn) Forecast, By Country and Sub-region, 2016 - 2026
10.6.1. The U.S.
10.6.2. Canada
10.6.3. Rest of North America
11. Europe Tokenization Market Analysis and Forecast
11.1. Key Findings
11.2. Tokenization Market Size (US$ Mn) Forecast, By Component, 2016 - 2026
11.2.1. Hardware
11.2.2. Software
11.2.2.1. On-Premise
11.2.2.2. Cloud
11.2.3. Services
11.2.3.1. Managed
11.2.3.2. Professional
11.3. Tokenization Market Size (US$ Mn) Forecast, By Enterprise Size, 2016 - 2026
11.3.1. Large Enterprise
11.3.2. Small & Medium Enterprise
11.4. Tokenization Market Size (US$ Mn) Forecast, By End-use, 2016 - 2026
11.4.1. BFSI
11.4.2. Retail & Consumer Goods
11.4.3. Government
11.4.4. Education
11.4.5. Military & Defense
11.4.6. Automotive
11.4.7. IT and Telecom
11.4.8. Energy and Utilities
11.4.9. Manufacturing
11.4.10. Others (Hospitality, Transportation etc.)
11.5. Tokenization Market Size (US$ Mn) Forecast, By Solution, 2016 - 2026
11.5.1. Payment Security
11.5.2. Customer Data Management
11.5.3. Compliance and Policy Management
11.5.4. Omni-channel management (Shopping Cart, Retail Devices, POS System, Payment Plugins)
11.5.5. Encryption
11.6. Tokenization Market Size (US$ Mn) Forecast, By Country and Sub-region, 2016 - 2026
11.6.1. Germany
11.6.2. France
11.6.3. UK
11.6.4. Rest of Europe
12. Asia Pacific Tokenization Market Analysis and Forecast
12.1. Key Findings
12.2. Tokenization Market Size (US$ Mn) Forecast, By Component, 2016 - 2026
12.2.1. Hardware
12.2.2. Software
12.2.2.1. On-Premise
12.2.2.2. Cloud
12.2.3. Services
12.2.3.1. Managed
12.2.3.2. Professional
12.3. Tokenization Market Size (US$ Mn) Forecast, By Enterprise Size, 2016 - 2026
12.3.1. Large Enterprise
12.3.2. Small & Medium Enterprise
12.4. Tokenization Market Size (US$ Mn) Forecast, By End-use, 2016 - 2026
12.4.1. BFSI
12.4.2. Retail & Consumer Goods
12.4.3. Government
12.4.4. Education
12.4.5. Military & Defense
12.4.6. Automotive
12.4.7. IT and Telecom
12.4.8. Energy and Utilities
12.4.9. Manufacturing
12.4.10. Others (Hospitality, Transportation etc.)
12.5. Tokenization Market Size (US$ Mn) Forecast, By Solution, 2016 - 2026
12.5.1. Payment Security
12.5.2. Customer Data Management
12.5.3. Compliance and Policy Management
12.5.4. Omni-channel management (Shopping Cart, Retail Devices, POS System, Payment Plugins)
12.5.5. Encryption
12.6. Tokenization Market Size (US$ Mn) Forecast, By Country and Sub-region, 2016 - 2026
12.6.1. China
12.6.2. Japan
12.6.3. India
12.6.4. Rest of Asia Pacific
13. Middle East & Africa (MEA) Tokenization Market Analysis and Forecast
13.1. Key Findings
13.2. Tokenization Market Size (US$ Mn) Forecast, By Component, 2016 - 2026
13.2.1. Hardware
13.2.2. Software
13.2.2.1. On-Premise
13.2.2.2. Cloud
13.2.3. Services
13.2.3.1. Managed
13.2.3.2. Professional
13.3. Tokenization Market Size (US$ Mn) Forecast, By Enterprise Size, 2016 - 2026
13.3.1. Large Enterprise
13.3.2. Small & Medium Enterprise
13.4. Tokenization Market Size (US$ Mn) Forecast, By End-use, 2016 - 2026
13.4.1. BFSI
13.4.2. Retail & Consumer Goods
13.4.3. Government
13.4.4. Education
13.4.5. Military & Defense
13.4.6. Automotive
13.4.7. IT and Telecom
13.4.8. Energy and Utilities
13.4.9. Manufacturing
13.4.10. Others (Hospitality, Transportation etc.)
13.5. Tokenization Market Size (US$ Mn) Forecast, By Solution, 2016 - 2026
13.5.1. Payment Security
13.5.2. Customer Data Management
13.5.3. Compliance and Policy Management
13.5.4. Omni-channel management (Shopping Cart, Retail Devices, POS System, Payment Plugins)
13.5.5. Encryption
13.6. Tokenization Market Size (US$ Mn) Forecast, By Country and Sub-region, 2016 - 2026
13.6.1. GCC
13.6.2. South Africa
13.6.3. Rest of MEA
14. South America Tokenization Market Analysis and Forecast
14.1. Key Findings
14.2. Tokenization Market Size (US$ Mn) Forecast, By Component, 2016 - 2026
14.2.1. Hardware
14.2.2. Software
14.2.2.1. On-Premise
14.2.2.2. Cloud
14.2.3. Services
14.2.3.1. Managed
14.2.3.2. Professional
14.3. Tokenization Market Size (US$ Mn) Forecast, By Enterprise Size, 2016 - 2026
14.3.1. Large Enterprise
14.3.2. Small & Medium Enterprise
14.4. Tokenization Market Size (US$ Mn) Forecast, By End-use, 2016 - 2026
14.4.1. BFSI
14.4.2. Retail & Consumer Goods
14.4.3. Government
14.4.4. Education
14.4.5. Military & Defense
14.4.6. Automotive
14.4.7. IT and Telecom
14.4.8. Energy and Utilities
14.4.9. Manufacturing
14.4.10. Others (Hospitality, Transportation etc.)
14.5. Tokenization Market Size (US$ Mn) Forecast, By Solution, 2016 - 2026
14.5.1. Payment Security
14.5.2. Customer Data Management
14.5.3. Compliance and Policy Management
14.5.4. Omni-channel management (Shopping Cart, Retail Devices, POS System, Payment Plugins)
14.5.5. Encryption
14.6. Tokenization Market Size (US$ Mn) Forecast, By Country and Sub-region, 2016 - 2026
14.6.1. Brazil
14.6.2. Rest of South America
15. Competition Landscape
15.1. Market Player – Competition Matrix
15.2. Market Revenue Share Analysis (%), By Company (2017)
16. Company Profiles
16.1. First Data Corporation
16.1.1. Company Overview
16.1.2. Financial Overview
16.1.3. Strategy
16.2. Ciphercloud
16.2.1. Company Overview
16.2.2. Financial Overview
16.2.3. Strategy
16.3. CyberSource Corporation
16.3.1. Company Overview
16.3.2. Financial Overview
16.3.3. Strategy
16.4. Tokenex Llc
16.4.1. Company Overview
16.4.2. Financial Overview
16.4.3. Strategy
16.5. Gemalto NV
16.5.1. Company Overview
16.5.2. Financial Overview
16.5.3. Strategy
16.6. Hewlett-Packard Enterprises
16.6.1. Company Overview
16.6.2. Financial Overview
16.6.3. Strategy
16.7. Protegrity USA, Inc.
16.7.1. Company Overview
16.7.2. Financial Overview
16.7.3. Strategy
16.8. Symantec Corporation
16.8.1. Company Overview
16.8.2. Financial Overview
16.8.3. Strategy
16.9. Thales E-Security, Inc.
16.9.1. Company Overview
16.9.2. Financial Overview
16.9.3. Strategy
16.10. Tokenex Llc
16.10.1. Company Overview
16.10.2. Financial Overview
16.10.3. Strategy
17. Key Takeaway
List of Tables
Table 1: North America ICT Spending (US$ Mn)
Table 2: Europe ICT Spending (US$ Mn)
Table 3: Asia Pacific ICT Spending (US$ Mn)
Table 4: MEA ICT Spending (US$ Mn)
Table 5: South America ICT Spending (US$ Mn)
Table 6: Pricing Model Analysis
Table 7: Global Tokenization Market Revenue (US$ Mn) Forecast, by Component, 2016 - 2026
Table 8: Global Tokenization Market Revenue (US$ Mn) Forecast, by Component, Software, 2016 - 2026
Table 9: Global Tokenization Market Revenue (US$ Mn) Forecast, by Component, Services, 2016 - 2026
Table 10: Global Tokenization Market Revenue (US$ Mn) Forecast, by Enterprise Size, 2016 - 2026
Table 11: Global Tokenization Market Revenue (US$ Mn) Forecast, by End-Use, 2016 - 2026
Table 12: Global Tokenization Market Revenue (US$ Mn) Forecast, by Solution, 2016 - 2026
Table 13: Global Tokenization Market Revenue (US$ Mn) Forecast, by Region, 2016 - 2026
Table 14: North America Tokenization Market Revenue (US$ Mn) Forecast, by Component, 2016 - 2026
Table 15: North America Tokenization Market Revenue (US$ Mn) Forecast, by Component, Software, 2016 - 2026
Table 16: North America Tokenization Market Revenue (US$ Mn) Forecast, by Component, Services, 2016 - 2026
Table 17: North America Tokenization Market Revenue (US$ Mn) Forecast, by Enterprise Size, 2016 - 2026
Table 18: North America Tokenization Market Revenue (US$ Mn) Forecast, by End-Use, 2016 - 2026
Table 19: North America Tokenization Market Revenue (US$ Mn) Forecast, by Solution, 2016 - 2026
Table 20: North America Tokenization Market Revenue (US$ Mn) Forecast, by Country, 2016 - 2026
Table 21: Europe Tokenization Market Revenue (US$ Mn) Forecast, by Component, 2016 - 2026
Table 22: Europe Tokenization Market Revenue (US$ Mn) Forecast, by Component, Software, 2016 - 2026
Table 23: Europe Tokenization Market Revenue (US$ Mn) Forecast, by Component, Services, 2016 - 2026
Table 24: Europe Tokenization Market Revenue (US$ Mn) Forecast, by Enterprise Size, 2016 - 2026
Table 25: Europe Tokenization Market Revenue (US$ Mn) Forecast, by End-Use, 2016 - 2026
Table 26: Europe Tokenization Market Revenue (US$ Mn) Forecast, by Solution, 2016 - 2026
Table 27: Europe Tokenization Market Revenue (US$ Mn) Forecast, by Country, 2016 - 2026
Table 28: Asia Pacific Tokenization Market Revenue (US$ Mn) Forecast, by Component, 2016 - 2026
Table 29: Asia Pacific Tokenization Market Revenue (US$ Mn) Forecast, by Component, Software, 2016 - 2026
Table 30: Asia Pacific Tokenization Market Revenue (US$ Mn) Forecast, by Component, Services, 2016 - 2026
Table 31: Asia Pacific Tokenization Market Revenue (US$ Mn) Forecast, by End-Use, 2016 - 2026
Table 32: Asia Pacific Tokenization Market Revenue (US$ Mn) Forecast, by Solution, 2016 - 2026
Table 33: Asia Pacific Tokenization Market Revenue (US$ Mn) Forecast, by Country, 2016 - 2026
Table 34: Middle East & Africa Tokenization Market Revenue (US$ Mn) Forecast, by Component, 2016 - 2026
Table 35: Middle East & Africa Tokenization Market Revenue (US$ Mn) Forecast, by Component, Software, 2016 - 2026
Table 36: Middle East & Africa Tokenization Market Revenue (US$ Mn) Forecast, by Component, Services, 2016 - 2026
Table 37: Middle East & Africa Tokenization Market Revenue (US$ Mn) Forecast, by Enterprise Size, 2016 - 2026
Table 38: Middle East & Africa Tokenization Market Revenue (US$ Mn) Forecast, by End-Use, 2016 - 2026
Table 39: Middle East & Africa Tokenization Market Revenue (US$ Mn) Forecast, by Solution, 2016 - 2026
Table 40: Middle East & Africa Tokenization Market Revenue (US$ Mn) Forecast, by Country, 2016 - 2026
Table 41: South America Tokenization Market Revenue (US$ Mn) Forecast, by Component, 2016 - 2026
Table 42: South America Tokenization Market Revenue (US$ Mn) Forecast, by Component, Software, 2016 - 2026
Table 43: South America Tokenization Market Revenue (US$ Mn) Forecast, by Component, Services, 2016 - 2026
Table 44: South America Tokenization Market Revenue (US$ Mn) Forecast, by Enterprise Size, 2016 - 2026
Table 45: South America Tokenization Market Revenue (US$ Mn) Forecast, by End-Use, 2016 - 2026
Table 46: South America Tokenization Market Revenue (US$ Mn) Forecast, by Solution, 2016 - 2026
Table 47: South America Tokenization Market Revenue (US$ Mn) Forecast, by Country, 2016 - 202
List of Figures
Figure 1: Global Tokenization Market Size (US$ Mn) Forecast, 2016–2026
Figure 2: Global Top 3 Regions, Market Share Analysis, 2017 & 2026 (%)
Figure 3: Global Top 5 Countries – CAGR (2018-2026) Analysis
Figure 4: Global Top 3 End-User Market Share Analysis, 2026
Figure 5: Global Segment market Share Analysis
Figure 6: Global Top 3 Solution Market Share Analysis, 2026
Figure 7: GDP (US$ Bn), Top Economies (2012-2017)
Figure 8: Top Economies GDP Landscape
Figure 9: Gross Domestic Product (GDP) per Capita; Analysis (1/2) (US$ Tn), By Major Countries, 2012-2017
Figure 10: Cyber Security Industry
Figure 12: ICT Spending (US$ Mn) Trend
Figure 13: Global Tokenization Market Size (US$ Mn) and Forecast, 2012 – 2026
Figure 14: Global Tokenization Market Opportunity Analysis, 2016 – 2026
Figure 15: North America Tokenization Market Attractiveness Analysis, by Component, (2018)
Figure 16: Europe Tokenization Market Attractiveness Analysis, by Component, (2018)
Figure 17: Asia Pacific Tokenization Market Attractiveness Analysis, by Component, (2018)
Figure 18: Middle East & Africa Tokenization Market Attractiveness Analysis, by Component, (2018)
Figure 19: South America Tokenization Market Attractiveness Analysis, by Component, (2018)
Figure 20: Global Tokenization Market Attractiveness Analysis, by Component, (2018)
Figure 21: North America Tokenization Market Attractiveness Analysis, by Enterprise Size, (2018)
Figure 22: Europe Tokenization Market Attractiveness Analysis, by Enterprise Size, (2018)
Figure 23: Asia Pacific Tokenization Market Attractiveness Analysis, by Enterprise Size, (2018)
Figure 24: Middle East & Africa Tokenization Market Attractiveness Analysis, by Enterprise Size, (2018)
Figure 25: South America Tokenization Market Attractiveness Analysis, by Enterprise Size, (2018)
Figure 26: Global Tokenization Market Attractiveness Analysis, by Enterprise Size, (2018)
Figure 27: North America Tokenization Market Attractiveness Analysis, by Solution, (2018)
Figure 28: Europe Tokenization Market Attractiveness Analysis, by Solution, (2018)
Figure 29: Asia Pacific Tokenization Market Attractiveness Analysis, by Solution, (2018)
Figure 30: Middle East & Africa Tokenization Market Attractiveness Analysis, by Solution, (2018)
Figure 31: South America Tokenization Market Attractiveness Analysis, by Solution, (2018)
Figure 32: Global Tokenization Market Attractiveness Analysis, by Solution, (2018)
Figure 33: North America Tokenization Market Attractiveness Analysis, by End-Use, (2018)
Figure 34: Europe Tokenization Market Attractiveness Analysis, by End-Use, (2018)
Figure 35: Asia Pacific Tokenization Market Attractiveness Analysis, by End-Use, (2018)
Figure 36: Middle East & Africa Tokenization Market Attractiveness Analysis, by End-Use, (2018)
Figure 37: South America Tokenization Market Attractiveness Analysis, by End-Use, (2018)
Figure 38: Global Tokenization Market Attractiveness Analysis, by End-Use, (2018)
Figure 39: North America Tokenization Market Attractiveness Analysis, by Country, (2018)
Figure 40: Europe Tokenization Market Attractiveness Analysis, by Country, (2018)
Figure 41: Asia Pacific Tokenization Market Attractiveness Analysis, by Country, (2018)
Figure 42: Middle East & Africa Tokenization Market Attractiveness Analysis, by Country, (2018)
Figure 43: South America Tokenization Market Attractiveness Analysis, by Country, (2018)
Figure 44: Global Tokenization Market Attractiveness Analysis, by Region, (2018)
Figure 45: Global Tokenization Market Value Share (Value %), by End-Use, 2018 & 2026
Figure 46: Global Tokenization Market Value Share (Value %), by Component, 2018 & 2026
Figure 47: Global Tokenization Market Value Share (Value %), by Application, 2018 & 2026
Figure 48: Global Tokenization Market Value Share (Value %), by Region, 2018 & 2026
Figure 50: Global Tokenization Market Share Analysis, by Component (2018)
Figure 51: Global Tokenization Market Share Analysis, by Component (2026)
Figure 52: Global Tokenization Market Share Analysis, by Enterprise Size (2018)
Figure 53: Global Tokenization Market Share Analysis, by Enterprise Size (2026)
Figure 54: Global Tokenization Market Share Analysis, by End-Use (2018)
Figure 55: Global Tokenization Market Share Analysis, by End-Use (2026)
Figure 56: Global Tokenization Market Share Analysis, by Solution (2018)
Figure 57: Global Tokenization Market Share Analysis, by Solution (2026)
Figure 58: Global Tokenization Market Share Analysis, by Region (2018)
Figure 59: Global Tokenization Market Share Analysis, by Region (2026)
Figure 60: North America Tokenization Market Size (US$ Mn) and Forecast, 2016 – 2026
Figure 61: North America Tokenization Market Opportunity Analysis, 2016 – 2026
Figure 62: North America Tokenization Market Share Analysis, by Component (2018)
Figure 63: North America Tokenization Market Share Analysis, by Component (2026)
Figure 64: North America Tokenization Market Share Analysis, by Enterprise Size (2018)
Figure 65: North America Tokenization Market Share Analysis, by Enterprise Size (2026)
Figure 66: North America Tokenization Market Share Analysis, by End-Use (2018)
Figure 67: North America Tokenization Market Share Analysis, by End-Use (2026)
Figure 68: North America Tokenization Market Share Analysis, by Solution (2018)
Figure 69: North America Tokenization Market Share Analysis, by Solution (2026)
Figure 70: North America Tokenization Market Share Analysis, by Country (2018)
Figure 71: North America Tokenization Market Share Analysis, by Country (2026)
Figure 72: Europe Tokenization Market Size (US$ Mn) and Forecast, 2016 – 2026
Figure 73: Europe Tokenization Market Opportunity Analysis, 2016 – 2026
Figure 74: Europe Tokenization Market Share Analysis, by Component (2018)
Figure 75: Europe Tokenization Market Share Analysis, by Component (2026)
Figure 76: Europe Tokenization Market Share Analysis, by Enterprise Size (2018)
Figure 77: Europe Tokenization Market Share Analysis, by Enterprise Size (2026)
Figure 78: Europe Tokenization Market Share Analysis, by End-Use (2018)
Figure 79: Europe Tokenization Market Share Analysis, by End-Use (2026)
Figure 80: Europe Tokenization Market Share Analysis, by Solution (2018)
Figure 81: Europe Tokenization Market Share Analysis, by Solution (2026)
Figure 82: Europe Tokenization Market Share Analysis, by Country (2018)
Figure 83: Europe Tokenization Market Share Analysis, by Country (2026)
Figure 84: Asia Pacific Tokenization Market Size (US$ Mn) and Forecast, 2016 – 2026
Figure 85: Asia Pacific Tokenization Market Opportunity Analysis, 2016 – 2026
Figure 86: Asia Pacific Tokenization Market Share Analysis, by Component (2018)
Figure 87: Asia Pacific Tokenization Market Share Analysis, by Component (2026)
Figure 88: Asia Pacific Tokenization Market Share Analysis, by Enterprise Size (2018)
Figure 89: Asia Pacific Tokenization Market Share Analysis, by Enterprise Size (2026)
Figure 90: Asia Pacific Tokenization Market Share Analysis, by End-Use (2018)
Figure 91: Asia Pacific Tokenization Market Share Analysis, by End-Use (2026)
Figure 92: Asia Pacific Tokenization Market Share Analysis, by Solution (2018)
Figure 93: Asia Pacific Tokenization Market Share Analysis, by Solution (2026)
Figure 94: Asia Pacific Tokenization Market Share Analysis, by Country (2018)
Figure 95: Asia Pacific Tokenization Market Share Analysis, by Country (2026)
Figure 96: Middle East & Africa Tokenization Market Size (US$ Mn) and Forecast, 2016 – 2026
Figure 97: Middle East & Africa Tokenization Market Opportunity Analysis, 2016 – 2026
Figure 98: Middle East & Africa Tokenization Market Share Analysis, by Component (2018)
Figure 99: Middle East & Africa Tokenization Market Share Analysis, by Component (2026)
Figure 100: Middle East & Africa Tokenization Market Share Analysis, by Enterprise Size (2018)
Figure 101: Middle East & Africa Tokenization Market Share Analysis, by Enterprise Size (2026)
Figure 102: Middle East & Africa Tokenization Market Share Analysis, by End-Use (2018)
Figure 103: Middle East & Africa Tokenization Market Share Analysis, by End-Use (2026)
Figure 104: Middle East & Africa Tokenization Market Share Analysis, by Solution (2018)
Figure 105: Middle East & Africa Tokenization Market Share Analysis, by Solution (2026)
Figure 106: Middle East & Africa Tokenization Market Share Analysis, by Country (2018)
Figure 107: Middle East & Africa Tokenization Market Share Analysis, by Country (2026)
Figure 108: South America Tokenization Market Size (US$ Mn) and Forecast, 2016 – 2026
Figure 109: South America Tokenization Market Opportunity Analysis, 2016 – 2026
Figure 110: South America Tokenization Market Share Analysis, by Component (2018)
Figure 111: South America Tokenization Market Share Analysis, by Component (2026)
Figure 112: South America Tokenization Market Share Analysis, by Enterprise Size (2018)
Figure 113: South America Tokenization Market Share Analysis, by Enterprise Size (2026)
Figure 114: South America Tokenization Market Share Analysis, by End-Use (2018)
Figure 115: South America Tokenization Market Share Analysis, by End-Use (2026)
Figure 116: South America Tokenization Market Share Analysis, by Solution (2018)
Figure 117: South America Tokenization Market Share Analysis, by Solution (2026)
Figure 118: South America Tokenization Market Share Analysis, by Country (2018)
Figure 119: South America Tokenization Market Share Analysis, by Country (2026
Copyright © Transparency Market Research, Inc. All Rights reserved
Trust Online


Tokenization Market