Surface Computing Market by Type (Flat and Curved Display), Vision (Two and Three Dimensional), Application (Automotive, Education, Entertainment, Financial Services, Government, Healthcare, Hospitality, and Retail), and by Region - Global Forecast to 2020


Surface computing systems, also known as tabletop computers, are expected to be the future of desktop. Many companies apart from Microsoft, such as HP, Sony, and Lenovo are developing computing systems of bigger screen size which have been termed as tabletop computers. Microsoft is also developing the Microsoft Surface Hub. Some of the important features of surface computing include multi-touch and multi-user technology, which helps in recognizing physical objects through touch. It uses natural user interface (NUI) to interact with users, thereby enhancing the user�s experience of digital content through natural gestures, touch, and physical objects. The surface computing market is expected to grow at a CAGR of ~36% between 2015 and 2020 and is expected to be worth USD 26.2 Billion by 2020.
The surface computing market has been segmented based on type of display into display which includes flat and curved displays. Flat display based surface computing systems accounted for a market share of ~92% in 2014. These displays come in two forms which include two dimensional and three dimensional systems. The market for three dimensional based surface computing systems is expected to grow at a high CAGR of ~43% between 2015 and 2020 though it held a very low market share in 2014. Surface computing systems are mainly implemented in applications such as automotive, education, entertainment, financial services, government, healthcare, hospitality, and retail. Hospitality and retail segments hold a major share in the surface computing market. The hospitality segment of the surface computing market is expected to grow at the highest CAGR of ~39% between 2015 and 2020.
The report also details the market dynamics such as drivers, restraints, challenges, and opportunities. Implementation of natural user interface, increase in the revenue of companies due to the adoption of multi user surface computers, and increased involvement of major players in the development of surface computers are some of the major factors which are driving the surface computer market. The high cost of surface computers and limited availability of related digital content are some of the restraints for the growth of the surface computing market. The studied market is expected to have a huge growth potential in applications such as hospitality, entertainment, and retail. Slow adoption of table shaped surface computes by end-users could act as a challenge for the growth of the surface computing market. Porter�s five forces analysis has been included in the report with a brief description of each of its forces and their respective impact on the surface computing market. The report also includes an analysis of the entire value chain for the surface computing market. It provides a detailed profile of the major companies in the studied market. Additionally, it covers the competitive landscape for key players by detailing their growth strategy in the surface computing market. The major players in the market include Microsoft Corp. (U.S.), Planar Systems Inc. (U.S.), 3M Co. (U.S.), Vertigo Systems GmbH (Germany), Touchmagix Media Private Limited (India), Nvision solutions Inc. (U.S.), EyeFactive GmbH (Germany), SensyTouch, Inc. (U.S.), and Ideum Inc. (U.S.) among others.
Get online access to the report on the World's First Market Intelligence Cloud
Request Sample Scope of the Report
:

This research report categorizes the global surface computing market based on type, vision, application, and region. Additionally, it also estimates and forecasts the market size of the surface computing market.
On the basis of Type:
The market has been segmented based on type into flat and curved surface computing devices.
On the basis of Vision:
The market has been segmented based on vision into two dimensional and three dimensional surface computing devices.
On the basis of application:
Automotive, education, entertainment, financial services, government, healthcare, hospitality, and retail are the applications which has been covered in the report
On the basis of Region:
The global surface computing market has also been split into four different regions, namely, North America, Europe, Asia-Pacific (APAC), and the Rest of the World (RoW).
Target audience of the report:
The intended audience for this report includes:
- Application developers
- Display technology providers
- Hardware and software providers
- Product designers and manufactures
- Research organizations and consulting companies
- Technology investors
Available customizations:
With the given market data, MarketsandMarkets offers customizations as per the company�s specific needs. The following customization options are available for the report:
Company Information
Detailed analysis and profiling of additional market players (up to five)
A surface computer comprises a table shape computer which interacts with the user through the surface of an ordinary object, thereby eliminating the use of a monitor and keyboard. It is a tabletop computer which enables multi-touch and multiple user interaction at the same time. There is an increase in demand for the surface computing technology as it enables multiple users to access the device simultaneously.
Surface computing devices are finding applications in various sectors such as automotive, education, entertainment, financial services, government, healthcare, hospitality, and retail. The market for such devices in applications including hospitality, education, entertainment, and retail is expected to witness a high growth rate between 2015 and 2020. However, the major market share is held by hospitality and retail applications of surface computing devices.
This report describes the market drivers, restraints and challenges for the market and forecasts the market between 2015 and 2020, in addition to segmenting it on the basis of type, vision, application, and region. The factors driving the surface computing market include the usage of a natural user interface (NUI) which enables a user friendly interaction, and adoption in large-scale applications
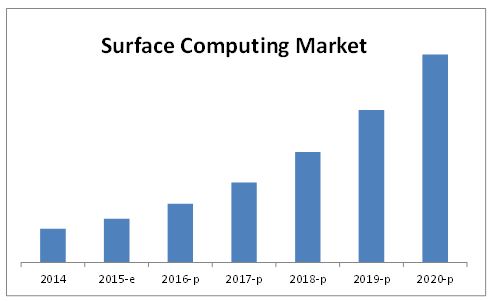
E � Estimated; P � Projected
Source: Press Releases, Investor Relation Presentations, Annual Reports, Expert Interviews, and MarketsandMarkets Analysis
The surface computing market is estimated to reach $26,206.29 Million by 2020, at a CAGR of 36.57% between 2015 and 2020. The flat display segment accounts for the major share of the market. This segment accounted for a market share of ~92% in 2014 and is expected to grow at a CAGR of 35.06% between 2015 and 2020. However, with the market for curved surface computers is expected to grow at a high CAGR of ~49% between 2015 and 2020. The market for three dimensional based surface computing systems is expected to witness the highest growth during the forecast period and is projected to grow at a CAGR of 43.14% between 2015 and 2020.
The report also includes the segmentation of the said market based on region, which includes North America, Europe, APAC, and RoW. APAC is expected to be the fastest-growing market for surface computing devices and is projected to register a CAGR of 42.27% between 2015 and 2020. North America is the largest market for surface computing devices and accounted for the highest market share of ~40% in 2014; it is expected to grow at a CAGR of 36.08% between 2015 and 2020.
The major players in the surface computing market include Microsoft Corp. (U.S.), Apple, Inc. (U.S.), Planar Systems Inc. (U.S.), 3M Co. (U.S.), Vertigo Systems GmbH (Germany), Touchmagix Media Private Limited (India), Nvision solutions Inc. (U.S.), EyeFactive GmbH (Germany), SensyTouch, Inc. (U.S.), and Ideum Inc. (U.S.) among others
Table of Contents
1 Introduction (Page No. - 14)
1.1 Objectives of the Study
1.2 Market Definition
1.3 Scope of the Study
1.3.1 Market By Application, Type, Components, and Interaction Methods
1.3.2 Region Analysis
1.3.3 Years Considered for the Study
1.4 Currency & Pricing
1.5 Limitations
1.6 Stakeholders
2 Research Methodology (Page No. - 18)
2.1 Research Data
2.1.1 Secondary Data
2.1.1.1 Key Data From Secondary Sources
2.1.2 Primary Data
2.1.2.1 Key Data From Primary Sources
2.1.2.2 Key Industry Insights
2.1.2.3 Breakdown of Primaries
2.2 Market Size Estimation
2.2.1 Bottom-Up Approach
2.2.2 Top-Down Approach
2.3 Market Breakdown & Data Triangulation
2.4 Research Assumptions
3 Executive Summary (Page No. - 27)
4 Premium Insight � Surface Computing Market (Page No. - 32)
4.1 Surface Computing Market, 2015-2020 ($Billion)
4.2 Application Segment in Market (2015-2020)
4.3 Market, By Region and Type� 2014
4.4 Market, By Region� 2015
4.5 Top Five Application in Market � 2015
4.6 Market, By Vision � 2020
5 Market Overview (Page No. - 38)
5.1 Introduction
5.2 Evolution
5.3 Market Segmentation
5.3.1 By Application
5.3.2 By Component
5.3.3 By Type
5.3.4 By Interaction Methods
5.3.5 By Region
5.4 Market Dynamics
5.4.1 Drivers
5.4.1.1 NUI (Natural User Interface) Greatly Help to Create A User Friendly Interaction Reducing Complexity
5.4.1.2 the Increasing Business Revenue Due to the Adoption of Multi User Surface Computer is Driving the Growth of This Market
5.4.1.3 Growing Emphasis of Major Players to Develop Surface Computers is Expected to Create Demand for This Market
5.4.2 Restraints
5.4.2.1 High Cost of Surface Computer Limits the Growth in the Demand
5.4.2.2 Limited Availability of Features Acts as A Restrain for the Development of Surface Computer Market
5.4.3 Opportunities
5.4.3.1 Surface Computer is Expected to Have Huge Opportunities in Hospitality and Entertainment
5.4.3.2 Increasing Use of Surface Computers for Corporate Purpose is Expected to Drive This Market
5.4.4 Challenges
5.4.4.1 the Acceptance of Table Shaped Surface Computer From End User Acts as A Challenge
6 Industry Trend (Page No. - 47)
6.1 Introduction
6.2 Value Chain Analysis
6.3 Porter�s Five Forces Analysis
6.3.1 Intensity of Rivalry
6.3.2 Threat of Substitutes
6.3.3 Bargaining Power of Buyers
6.3.4 Bargaining Power of Suppliers
6.3.5 Threat of New Entrants
6.4 Strategic Benchmarking
6.4.1 Technology Integration & Product Enhancement
7 Market Analysis, By Type (Page No. - 56)
7.1 Introduction
7.2 Components
7.2.1 Display
7.2.2 Infrared Camera
7.2.3 Projector
7.2.4 Sensor
7.2.5 Processor and Software
7.3 Flat Display
7.4 Curved Display
8 Market Analysis, By Vision (Page No. - 66)
8.1 Introduction
8.2 Two Dimensional
8.3 Three Dimensional
9 Market Analysis, By Application (Page No. - 74)
9.1 Introduction
9.2 Automotive
9.3 Education
9.4 Entertainment
9.5 Financial Services
9.6 Government
9.7 Healthcare
9.8 Hospitality
9.9 Retail
10 Region Analysis (Page No. - 96)
10.1 Introduction
10.2 North America
10.3 Europe
10.4 Asia-Pacific
10.5 Rest of the World
11 Competitive Landscape (Page No. - 120)
11.1 Overview
11.2 Market Share Analysis, Surface Computer Market
11.3 Competitive Situation and Trends
11.3.1 New Product Launches
11.3.2 Agreements & Contracts, Partnerships, Collaborations, and Joint Ventures
11.3.3 Expansions
11.3.4 Others
12 Company Profiles (Page No. - 130)
12.1 Introduction
12.2 Apple Inc.
12.2.1 Business Overview
12.2.2 Product Portfolio
12.2.3 Recent Developments
12.2.4 MnM View
12.2.4.1 Key Strategy
12.2.4.2 Swot Analysis
12.3 Microsoft Corporation
12.3.1 Business Overview
12.3.2 Products Portfolio
12.3.3 Recent Developments
12.3.4 MnM View
12.3.4.1 Key Strategy
12.3.4.2 Swot Analysis
12.4 Planar Systems Inc.
12.4.1 Business Overview
12.4.2 Product Portfolio
12.4.3 Recent Developments
12.4.4 MnM View
12.4.4.1 Key Strategy
12.4.4.2 Swot Analysis
12.5 3M Co.
12.5.1 Product Portfolio
12.5.2 Recent Development
12.5.3 MnM View
12.5.3.1 Key Strategy
12.5.3.2 Swot Analysis
12.6 Eyefactive GmbH
12.6.1 Business Overview
12.6.2 Product Portfolio
12.7 Ideum Inc.
12.7.1 Business Overview
12.7.2 Product Portfolio
12.7.3 Recent Developments
12.7.4 MnM View
12.7.4.1 Key Strategy
12.8 Nvision Solutions Inc.
12.8.1 Business Overview
12.8.2 Product Portfolio
12.8.3 Recent Development
12.9 Sensytouch, Inc
12.9.1 Business Overview
12.9.2 Product Portfolio
12.9.3 Recent Developments
12.9.4 MnM View
12.9.4.1 Key Strategy
12.10 Touchmagix Media Private Limited
12.10.1 Business Overview
12.10.2 Product Portfolio
12.11 Vertigo Systems GmbH
12.11.1 Business Overview
12.11.2 Product Portfolio
12.11.3 Recent Developments
12.11.4 MnM View
12.11.4.1 Key Strategy
13 Appendix (Page No. - 155)
13.1 Insights of Industry Experts
13.2 Discussion Guide
13.3 Introducing RT: Real Time Market Intelligence
13.4 Available Customizations
13.5 Related Reports
List of Tables (70 Tables)
Table 1 Surface Computing Market Size, By Type, 2014-2020 ($Million)
Table 2 Natural User Interface is Expected to Boost the Demand
Table 3 High Cost of Surface Computer Limits the Demand of Surface Computer
Table 4 Huge Opportunity for Surface Compter is Expected From Hospitality Industry
Table 5 Difficulty in Adoption of Table Shaped Horizontal Surface Computer is Acting as Major Challenges
Table 6 Market Size, By Type, 2014-2020 ($Million)
Table 7 Market Size, By Value ($Million) and Volume (Million Units) 2014-2020
Table 8 Flat Display: Surface Computing Market Size, By Application, 2014-2020, ($Million)
Table 9 Flat Display: Market Size, By Vision, 2014-2020, ($Million)
Table 10 Flat Display: Surface Computing Market Size, By Region, 2014-2020, ($Million)
Table 11 Curved Display: Surface Computing Market Size, By Application, 2014-2020, ($Million)
Table 12 Curved Display: Market Size, By Vision, 2014-2020, ($Million)
Table 13 Curved Display: Market Size, By Region, 2014-2020, ($Million)
Table 14 Market Size, By Vision, 2014-2020, ($Million)
Table 15 2D: Surface Computing Market Size, By Type, 2014-2020, ($Million)
Table 16 2D: Market Size, By Application, 2014-2020, ($Million)
Table 17 2D: Market Size, By Region, 2014-2020, ($Million)
Table 18 3D: Market Size, By Type, 2014-2020, ($Million)
Table 19 3D: Market Size, By Application, 2014-2020, ($Million)
Table 20 3D: Market Size, By Region, 2014-2020, ($Million)
Table 21 Market Size, By Application, 2014-2020 ($Million)
Table 22 Automotive: Surface Computing Market Size, By Type, 2015-2020 ($Million)
Table 23 Automotive: Market Size, By Vision, 2015-2020 ($Million)
Table 24 Automotive: Market Size, By Region, 2015-2020 ($Million)
Table 25 Education: Surface Computing Market Size, By Type, 2015-2020 ($Million)
Table 26 Education: Market Size, By Vision, 2015-2020 ($Million)
Table 27 Education: Market Size, By Region, 2015-2020 ($Million)
Table 28 Entertainment: Surface Computing Market Size, By Type, 2015-2020 ($Million)
Table 29 Entertainment: Market Size, By Vision, 2015-2020 ($Million)
Table 30 Entertainment: Market Size, By Region, 2015-2020 ($Million)
Table 31 Financial Services: Surface Computing Market Size, By Type, 2015-2020 ($Million)
Table 32 Financial Services: Market Size, By Vision, 2015-2020 ($Million)
Table 33 Financial Services: Market Size, By Region, 2015-2020 ($Million)
Table 34 Government: Surface Computing Market Size, By Type, 2015-2020 ($Million)
Table 35 Government: Market Size, By Vision, 2015-2020 ($Million)
Table 36 Government: Market Size, By Region, 2015-2020 ($Million)
Table 37 Healthcare: Surface Computing Market Size, By Type, 2015-2020 ($Million)
Table 38 Healthcare: Market Size, By Vision, 2015-2020 ($Million)
Table 39 Healthcare: Market Size, By Region, 2015-2020 ($Million)
Table 40 Hospitality: Surface Computing Market Size, By Type, 2015-2020 ($Million)
Table 41 Hospitality: Market Size, By Vision, 2015-2020 ($Million)
Table 42 Hospitality: Market Size, By Region, 2015-2020 ($Million)
Table 43 Retail: Surface Computing Market Size, By Type, 2015-2020 ($Million)
Table 44 Retail: Market Size, By Vision, 2015-2020 ($Million)
Table 45 Retail: Market Size, By Region, 2015-2020 ($Million)
Table 46 Market Size, By Region, 2014-2020 ($Million)
Table 47 NA: Surface Computing Market Size, By Type, 2014-2020, ($Million)
Table 48 NA: Market Size, By Vision, 2014-2020, ($Million)
Table 49 NA: Flat Surface Computing Market Size, By Application, 2014-2020, ($Million)
Table 50 NA: Curved Surface Computing Market Size, By Application, 2014-2020, ($Million)
Table 51 NA: Market Size, By Application, 2014-2020, ($Million)
Table 52 Europe: Surface Computing Market Size, By Type, 2014-2020, ($Million)
Table 53 Europe: Market Size, By Vision, 2014-2020, ($Million)
Table 54 Europe: Flat Surface Computing Market Size, By Application, 2014-2020, ($Million)
Table 55 Europe: Curved Surface Computing Market Size, By Application, 2014-2020, ($Million)
Table 56 Europe: Surface Computing Market Size, By Application, 2014-2020, ($Million)
Table 57 APAC: Surface Computing Market Size, By Type, 2014-2020, ($Million)
Table 58 APAC: Market Size, By Vision, 2014-2020, ($Million)
Table 59 APAC: Flat Surface Computing Market Size, By Application, 2014-2020, ($Million)
Table 60 APAC: Curved Surface Computing Market Size, By Application, 2014-2020, ($Million)
Table 61 APAC: Surface Computing Market Size, By Application, 2014-2020, ($Million)
Table 62 RoW: Market Size, By Type, 2014-2020, ($Million)
Table 63 RoW: Market Size, By Vision, 2014-2020, ($Million)
Table 64 RoW: Flat Surface Computing Market Size, By Application, 2014-2020, ($Million)
Table 65 RoW: Curved Surface Computing Market Size, By Application, 2014-2020, ($Million)
Table 66 RoW: Market Size, By Application, 2014-2020, ($Million)
Table 67 New Product Launches, 2014�2015
Table 68 Agreements & Contracts, Partnerships, Collaborations, and Joint Ventures, 2014�2015
Table 69 Expansions, 2012�2015
Table 70 Research & Development, 2014
List of Figures (72 Figures)
Figure 1 Surface Computer Market, By Application
Figure 2 Research Design
Figure 3 Bottom-Up Approach
Figure 4 Top-Down Approach
Figure 5 Data Triangulation
Figure 6 Assumptions of the Research Study
Figure 7 Surface Computing Market Segmentation, By Application
Figure 8 Surface Computing Application Market Snapshot (2015 vs. 2020): Hospitality and Retail is Expected to Account Major Share During the Forecast Period
Figure 9 Market, By Vision (2015)
Figure 10 Market, By Region (2015)
Figure 11 Attractive Opportunity in the Market
Figure 12 Hospitality Application Accounted for Largest Market Share in Surface Computing Market
Figure 13 Curved Display Based Surface Computing is Expected to Grow at A High CAGR Between 2015 and 2020
Figure 14 U.S. Accounted for the Largest Market Share in the Market
Figure 15 Hospitality and Retail are Expected to Have Largest Market Share in Surface Computing Market in 2015
Figure 16 Three Dimensional Based Surface Computing is Expected to Grow With High CAGR Between 2015 and 2020
Figure 17 Evolution of Surface Computer
Figure 18 Surface Computer Market, By Application
Figure 19 Demand for Surface Computer System is Expected to Increase in Next 5-6 Years
Figure 20 Value Chain Analysis: Major Value is Added During Software and Hardware Development of Surface Computer
Figure 21 Porter�s Five Forces Analysis
Figure 22 Intensity of Rivalry
Figure 23 Threat of Substitutes
Figure 24 Bargaining Power of Buyers
Figure 25 Bargaining Power of Suppliers
Figure 26 Threat of New Entrants
Figure 27 Strategic Benchmarking: Microsoft Corporation and Apple, Inc. Largely Adopted Inorganic Growth Strategies for Technology Integration and Product Enhancement
Figure 28 Curved Surface Computing Systems is Expected to Grow With High CAGR Between 2015 and 2020
Figure 29 Hospitality Segment Accounts High Market Size in 2015
Figure 30 Huge Demand is Expected in North America for Flat Surface Computing Systems in 2015
Figure 31 Three Dimensional Curved Surface Computing System is Expected to Grow With High CAGR Between 2015 and 2020
Figure 32 Three Dimensional Base Surface Computing is Expected to Grow With High CAGR
Figure 33 Hospitality Application for 2D Surface Computing System is Expected to Account High Market Size in 2020
Figure 34 Curved Surface Computing With 3D Display Systems is Expected to Grow With High CAGR
Figure 35 North America Expected to Account High Market Share By 2020
Figure 36 Hospitality Application of Surface Computing Market is Expected to Account High Market Size in 2020
Figure 37 Curved Display of Market is Expected to Grow With High CAGR
Figure 38 North America is Expected to Grow With High CAGR in Education Application
Figure 39 Curved Display for Entertainment Application of Surface Computing System is Expected to Account High Market Size in 2020
Figure 40 North America Expected to Account High Market Share By 2020
Figure 41 North America and Asia Pacific Region Expected to Occupy High Market Size in Government Application of Market
Figure 42 Curved Surface Computing in Healthcare is Expected to Grow With High CAGR
Figure 43 Flat Surface Computing Market is Expected to Account High Market Share in Hospitality Application
Figure 44 Asia Pacific in Retail Application Expected to Grow With High CAGR Between 2015 and 2020
Figure 45 Geographic Snapshot - Developing Countries are Emerging as New Hot Spots
Figure 46 North America is Expected to Dominate the Surface Computer Market Between 2015 and 2020
Figure 47 North America Snapshot (2014-2020): Demand is Likely to Be Driven By Huge Investments By Big Players in the Surface Computer Market
Figure 48 Flat Display is Expected to Dominate the North America Surface Computer Market
Figure 49 Two Dimensional Dominates the Surface Computer Market in North America
Figure 50 Education Application to Grow at A Highest CAGR Between 2015 and 2020
Figure 51 Curved Display is Expected to Show Potential Growth in Europe With Highest CAGR Between 2015 and 2020
Figure 52 Healthcare Expected to Grow at Highest CAGR Between 2015 and 2020
Figure 53 Asia Pacific Surface Computer Market Snapshot: Three Dimensional Vision is the Most Lucrative Market
Figure 54 Flat Display Market Occupies the Major Share of Asia Pacific for Surface Computing Market
Figure 55 Surface Computer Market in Hospitality is Expected to Grow in Asia Pacific Region
Figure 56 Flat Display Expected to Occupy High Market Size By 2020
Figure 57 Companies Adopted Product Innovation and Expansions as the Key Growth Strategies (2013�2015)
Figure 58 Microsoft Corporation Showed the Highest Growth Rate Between 2012 and 2014
Figure 59 Market Rankings of the Top Players: Surface Computing Market � 2014
Figure 60 Market Evolution Framework�Significant New Product Launches Boosted Growth and Innovation in 2014
Figure 61 Battle for Market Share: New Product Launches Was the Key Strategy Adopted By the Companies
Figure 62 Geographic Revenue Mix of Top 5 Market Players
Figure 63 Apple Inc.: Company Snapshot
Figure 64 Microsoft Corporation: Company snapshot
Figure 65 Planar Systems Inc.: Company Snapshot
Figure 66 3M Co.: Company Snapshot
Figure 67 Eyefactive GmbH: Company Snapshot
Figure 68 Ideum Inc: Company Snapshot
Figure 69 Nvision Solutions Inc.: Company Snapshot
Figure 70 Sensytouch : Company Snapshot
Figure 71 Touchmagix Media Private Limited: Company Snapshot
Figure 72 Vertigo Systems GmbH: Company Snapshot


Growth opportunities and latent adjacency in Surface Computing Market