Analytics as a Service Market by Component, Deployment Mode, Organization Size, Industry Vertical (BFSI, Telecommunications and IT, Healthcare and Life Sciences, and Retail and eCommerce), and Region - Global Forecast to 2024


Analytics As A Service Market Growth & Trends
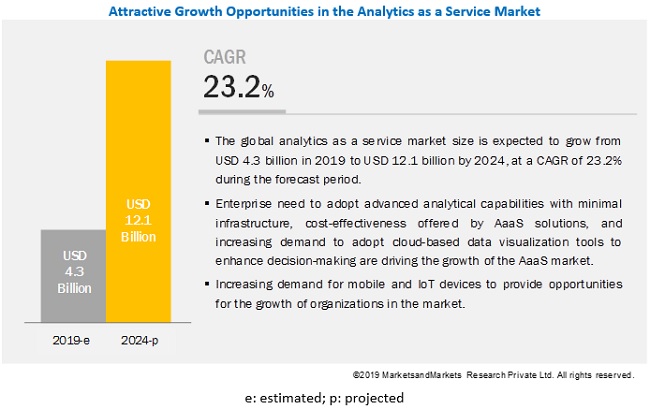
The global Analytics As A Service Market size was valued at $4.3 billion in 2019 and it is projected to reach $12.1 billion by the end of 2024 at a CAGR of 23.2% during the forecast period. The major growth factors of the analytics as a service market include the increasing awareness of IoT devices among organizations, the need to manage huge workloads with minimal infrastructure investments, and the adoption of big data analytics solutions for analyzing data which helps make faster business decisions.
Among solutions, the marketing analytics segment to grow at the highest CAGR during the forecast period
The analytics as a service market is segmented by solution into financial analytics, risk analytics, markering analytics, web analytics, supply chain analytics, security analytics, IT operations analytics, and others, which includes HR analytics and legal analytics. The marketing analytics segment is expected to grow at the highest CAGR during the forecast period. Analytics as a service solutions can enable companies to increase operational efficiencies and reduce costs. Companies are adopting analytics as a service solutions and services as it helps them analyze marketing activities, which, in turn, enable them to optimize RoI. Analytics as a service solutions and services help businesses store, manage, and predict data for analyzing and making effective business decisions. Numerous companies are implementing Analytics as a service solutions and services to evaluate their internal processes and enhance operations. Analytics as a service solutions’ implementation assists the companies in striking the right balance between operational cost, speed, flexibility, and quality. The financial analytics segment is expected to hold the largest market size during the forecast period. analytics as a service solutions enable data experts understand various trends, such as identifying financial growth opportunities, financial benchmarking against industry standards, and identifying financial implications.
Public cloud segment to grow at a rapid pace during the forecast period
Most vendors in the analytics as a service market offer cloud-based Analytics as a service solutions to maximize profits and automate the equipment maintenance process, effectively. The adoption of public cloud-based analytics as a service solutions is expected to grow, due to the benefits such as easy maintenance of generated data, cost-effectiveness, agility, flexibility, scalability, and effective management of these solutions. Companies prefer to adopt public cloud-based analytics as a service solutions, as these support their regional, cross-regional or cross-country data recovery strategies. This enables them to ensure resiliency in case of a disaster.
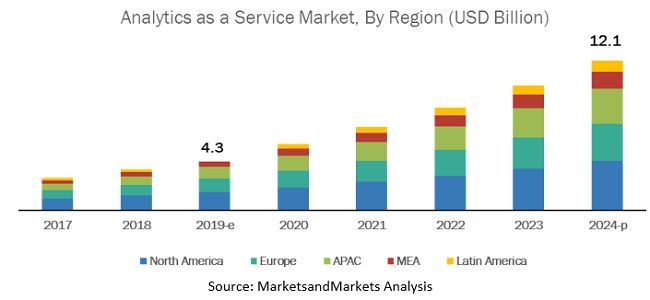
North America to hold the highest market share during the forecast period
North America is expected to hold the highest share in the global analytics as a service market, while Asia Pacific (APAC) is expected to grow at the highest CAGR during the forecast period. North America is the most significant revenue contributor to the global analytics as a service market. The region is witnessing significant developments in the market. In North America, the high growth rate can be attributed to the increasing adoption of big data, the large base of analytics as a service vendors in the region, and the rising adoption of IoT devices. Organizations, especially in the US, have started using analytics as a service solutions to generate data insights for making strategic business decisions and remaining competitive in the market. The increasing demand for dashboards to have statistical representation of data is triggering vendors to launch a number of analytics as a service solutions and services to cater to various needs of the organizations and their customers.
Key Market Players
Major vendors in the global analytics as a service market include Microsoft (US), Teradata (US), IBM (US), Oracle (US), SAS Institute (US), Atos (France), Google (US), AWS (US), HPE (US), Hitachi Vantara (Japan), Salesforce (US), Cloudera (US), MicroStrategy (US), SAP (Germany), ThoughtSpot (US), Qlik (US), Domo (US), TIBCO Software (US), Sisense (US), GoodData (US), Birst (US), Yellowfin (Australia), Guavus (US), Absolutdata (US), Alteryx(US), Looker (US), Pyramid Analytics (Europe), and Board International (Switzerland). These vendors have adopted various organic and inorganic growth strategies, such as new product launches, partnerships and collaborations, and mergers and acquisitions, to expand their presence in the global market.
AWS (US) offers cloud computing services in the form of web services. The company offers a wide range of products and services to customers present in 190 countries. It offers a wide range of products in the field of analytics, application integration, Augmented Reality (AR) and Virtual Reality (VR), IoT, blockchain, ML, robotics, satellite, quantum technologies, security, and many other fields. AWS product portfolio comprises segments, such as compute, storage, database, migration, network and content delivery, developer tools, management tools, media services, ML, and analytics. Additionally, the solutions segment offers website and web apps, mobile services, backup, storage and archive, financial services, and digital media. In the analytics as a service market, AWS offers Data Lakes and Analytics on AWS. The company’s analytics services are purpose-built for a wide range of analytics use cases, such as interactive analysis, big data processing using Apache Spark and Hadoop, data warehousing, real-time analytics, operational analytics, dashboards, and visualizations. The company offers interactive analytics through Amazon Athena, real-time analytics through Amazon Kinesis, operational analytics through Amazon Elasticsearch Service, and dashboard and visualizations through Amazon QuickSight.
Recent Developments
- In December 2019, AWS announced the availability of Advanced Query Accelerator (AUQA) for Amazon Redshift service. This service would help organizations customers with a new scale of data and analytical tools to run 3x faster than any other cloud data warehouse.
- In June 2019, Salesforce acquired Tableau, which is known for providing an analytical platform for its customers. This acquisition will help Salesforce enhance its Customer 360 platform with Tableau Self-Service analytics to drive greater role toward digital transformation, enabling companies to tap deeper data insights for making smarter decisions.
- In December 2019, HPE announced a new platform named GreenLake Central to delivers its entire cloud portfolio as as service. The platform will provide HPE customers with a consistent cloud experience for all their applications and data through operational data that run, manage, and optimize the entire hybrid IT estate.
- In October 2019, Teradata announced new offerings to help companies use Vantage to simplify their analytic ecosystems on their cloud journey. Teradata Vantage now unifies analytics, data lakes, and data warehouses in the cloud. The company is set to soon expand its public cloud offerings to include Google Cloud Platform.
- In November 2019, Cloudera launched the Cloudera Connect program on Cloudera Data platform. This launch will enable Cloudera’s partners to accelerate their customer enterprise data strategies and deliver powerful self-service analytical businesses across the hybrid and multicloud environment.
Frequently Asked Questions (FAQ):
What is Analytics as a Service (AaaS)?
Analytics as a service typically offers fully customizable business intelligence solutions with end-to-end capabilities, organizing, analyzing, and presenting data in a way that non-IT professionals gain insights and act. The ubiquitous rise of Big Data and expenses of parsing these massive data sets is leading Chief Information Officers (CIOs) opt for analytics as a service cost-effective web solutions over traditional licensed on-premise solutions.
What are the top vendors in analytics as a Service market?
Major vendors offering analytics as a service and services includes Microsoft, Google, AWS, Oracle, IBM, SAP, Teradata, Salesforce, TIBCO Software, SAS Institute, Sisense, Atos, HPE, Hitachi Vantara, Cloudera, ThoughtSpot, MicroStrategy, Qlik, Domo, and GoodData. These vendors have adopted different types of organic and inorganic growth strategies such as new product launches, partnerships and collaborations, and mergers and acquisitions to expand their offerings in the market.
What is the market size of Analytics as a Service market?
The global analytics as a service market size is expected to grow from USD 4.3 billion in 2019 to USD 12.1 billion by 2024, at a Compound Annual Growth Rate (CAGR) of 23.2% during the forecast period. The major growth factors of the analytics as a service market include the increasing awareness of IoT devices among organizations, the need to manage huge workloads with minimal infrastructure investments, and the adoption of big data analytics solutions for analyzing data which helps make faster business decisions
Which industry verticals are adopting Analytics as a service and services?
The top industry verticals adopting analytics as a service include BFSI, telecommunications and IT, retail and eCommerce, healthcare and life sciences, and manufacturing. Enterprises are increasingly adopting analytics as a service solutions due to advanced analytical capabilities of analytics as a service with minimal infrastructure and cost-effectiveness.
What are the regulations impacting the Analytics as a service Market?
The acts or regulations having impact on the growth of analytics as a service market include General Data Protection Regulation, United States Securities and Exchange Commission, Health Insurance Portability and Accountability Act (HIPAA), Health Information Technology for Economic and Clinical Health Act, California Consumer Privacy Act, Sarbanes-Oxley Act Of 2002, and Payment Card Industry Data Security Standard. .
To speak to our analyst for a discussion on the above findings, click Speak to Analyst
Table of Contents
1 Introduction (Page No. - 21)
1.1 Objectives of the Study
1.2 Market Definition
1.2.1 Inclusions and Exclusions
1.3 Market Scope
1.3.1 Market Segmentation
1.3.2 Regions Covered
1.4 Years Considered for the Study
1.5 Currency Considered
1.6 Stakeholders
2 Research Methodology (Page No. - 25)
2.1 Research Data
2.1.1 Secondary Data
2.1.2 Primary Data
2.1.2.1 Breakup of Primary Profiles
2.1.2.2 Key Industry Insights
2.2 Market Breakup and Data Triangulation
2.3 Market Size Estimation
2.3.1 Top-Down Approach
2.3.2 Bottom-Up Approach
2.4 Market Forecast
2.5 Assumptions for the Study
2.6 Limitations of the Study
3 Executive Summary (Page No. - 35)
4 Premium Insights (Page No. - 40)
4.1 Attractive Market Opportunities in the Analytics as a Service Market
4.2 Market: Top 3 Solutions
4.3 Market: By Region
4.4 Analytics as a Service Market in North America, By Solution and Industry Vertical
5 Market Overview and Industry Trends (Page No. - 42)
5.1 Introduction
5.2 Market Dynamics
5.2.1 Drivers
5.2.1.1 Increasing Demand for Dashboards for Data Visualization to Enhance the Ability in Taking Business Decisions
5.2.1.2 Cost-Effectiveness Offered By Analytics as a Service Solution
5.2.1.3 Enterprise Need to Adopt Advanced Analytical Capabilities With the Minimal Infrastructure
5.2.2 Restraints
5.2.2.1 Increasing Concerns Related to Data Privacy and Security
5.2.2.2 Lack of Analytical Skills
5.2.3 Opportunities
5.2.3.1 Increasing Demand for Internet of Things Devices
5.2.4 Challenges
5.2.4.1 Resiliency, Cloud Availability, and Information Lifecycle Management
5.3 Use Cases
5.3.1 Use Case: Improving Manufacturing and Planning Processes With Cognos and Planning Analytics
5.3.2 Use Case: Building Data-Driven Retail Machine Through Self-Service Analysis
5.3.3 Use Case: Boosting Data Analysis Productivity Through Business Intelligence Solutions
5.3.4 Use Case: Enhancing Customer Experience With Real-Time Analytics
5.3.5 Use Case: Becoming Leading Data-Driven Provider Through Self-Service Platform
5.3.6 Use Case: Improving Sales Ability Through Cloud-Based Azure Analytics Solutions and Power Business Intelligence
5.3.7 Use Case: Predicting Future Power Consumption Patterns
5.4 Regulatory Implications
5.4.1 General Data Protection Regulation
5.4.2 United States Securities and Exchange Commission
5.4.3 Comprehensive Capital Analysis and Review
5.4.4 Dodd-Frank Act
5.4.5 Payment Card Industry Data Security Standard
5.4.6 the International Organization for Standardization 27001
5.4.7 California Consumer Privacy Act
5.4.8 Health Insurance Portability and Accountability Act of 1996
5.4.9 Health Information Technology for Economic and Clinical Health Act
5.4.10 European Market Infrastructure Regulation
5.4.11 Basel Committee on Banking Supervision 239 Compliance
5.4.12 Sarbanes-Oxley Act of 2002
5.4.13 Personal Data Protection Act
5.5 Analytics as a Service: Functional Elements
6 Analytics as a Service Market, By Component (Page No. - 56)
6.1 Introduction
6.1.1 Component: Analytics as a Service Market Drivers
6.2 Solutions
6.3 Financial Analytics
6.4 Risk Analytics
6.5 Marketing Analytics
6.6 Web Analytics
6.7 Supply Chain Analytics
6.8 Security Analytics
6.9 IT Operations Analytics
6.10 Others
6.11 Services
6.11.1 Managed Services
6.11.2 Professional Services
6.11.2.1 Consulting
6.11.2.2 Support and Maintenance
7 Analytics as a Service Market, By Deployment Mode (Page No. - 71)
7.1 Introduction
7.1.1 Deployment Mode: Market Drivers
7.2 Public Cloud
7.3 Private Cloud
7.4 Hybrid Cloud
8 Analytics as a Service Market, By Organization Size (Page No. - 76)
8.1 Introduction
8.1.1 Organization Size: Market Drivers
8.2 Small and Medium-Sized Enterprises
8.3 Large Enterprises
9 Analytics as a Service Market, By Industry Vertical (Page No. - 80)
9.1 Introduction
9.1.1 Industry Vertical: Market Drivers
9.2 Banking, Financial Services, and Insurance
9.3 Retail and Ecommerce
9.4 Telecommunications and IT
9.5 Healthcare and Life Sciences
9.6 Manufacturing
9.7 Government and Defense
9.8 Media and Entertainment
9.9 Other Industry Verticals
10 Analytics as a Service Market, By Region (Page No. - 90)
10.1 Introduction
10.2 North America
10.2.1 North America: Market Drivers
10.2.2 United States
10.2.3 Canada
10.3 Europe
10.3.1 Europe: Market Drivers
10.3.2 United Kingdom
10.3.3 Germany
10.3.4 France
10.3.5 Italy
10.3.6 Rest of Europe
10.4 Asia Pacific
10.4.1 Asia Pacific: Analytics as a Service Market Drivers
10.4.2 China
10.4.3 Japan
10.4.4 India
10.4.5 Rest of Asia Pacific
10.5 Middle East and Africa
10.5.1 Middle East and Africa: Market Drivers
10.5.2 Kingdom of Saudi Arabia
10.5.3 United Arab Emirates
10.5.4 South Africa
10.5.5 Rest of Middle East and Africa
10.6 Latin America
10.6.1 Latin America: Market Drivers
10.6.2 Brazil
10.6.3 Mexico
10.6.4 Argentina
10.6.5 Rest of Latin America
11 Competitive Landscape (Page No. - 131)
11.1 Introduction
11.2 Competitive Leadership Mapping
11.2.1 Visionary Leaders
11.2.2 Innovators
11.2.3 Dynamic Differentiators
11.2.4 Emerging Companies
12 Company Profiles (Page No. - 133)
12.1 Introduction
(Business Overview, Solutions/Services Offered, Recent Developments, SWOT Analysis, and Right-To-Win)*
12.2 Microsoft
12.3 Google
12.4 AWS
12.5 Oracle
12.6 IBM
12.7 SAP
12.8 Teradata
12.9 Salesforce
12.10 TIBCO Software
12.11 SAS Institute
12.12 Sisense
12.13 Atos
12.14 HPE
12.15 Hitachi Vantara
12.16 Cloudera
12.17 MicroStrategy
12.18 ThoughtSpot
12.19 Qlik
12.20 Domo
12.21 GoodData
12.22 Alteryx
* Business Overview, Solutions/Services Offered, Recent Developments, SWOT Analysis, and Right-To-Win Might Not be Captured in Case of Unlisted Companies.
12.23 Absolutdata
12.24 Birst
12.25 Yellowfin
12.26 Guavus
12.27 Looker
12.28 Board International
12.29 Pyramid Analytics
13 Appendix (Page No. - 200)
13.1 Industry Experts
13.2 Discussion Guide
13.3 Knowledge Store: Marketsandmarkets’ Subscription Portal
13.4 Available Customizations
13.5 Related Reports
13.6 Author Details
List of Tables (132 Tables)
Table 1 United States Dollar Exchange Rate, 2016–2018
Table 2 Factor Analysis
Table 3 Global Analytics as a Service Market Size and Growth Rate, 2017–2024 (USD Million, Y-O-Y%)
Table 4 Market Size, By Component, 2017–2024 (USD Million)
Table 5 Market Size, By Solution, 2017–2024 (USD Million)
Table 6 Solutions: Market Size, By Region, 2017–2024 (USD Million)
Table 7 Financial Analytics: Market Size, By Region, 2017–2024 (USD Million)
Table 8 Risk Analytics: Market Size, By Region, 2017–2024 (USD Million)
Table 9 Marketing Analytics: Market Size, By Region, 2017–2024 (USD Million)
Table 10 Web Analytics: Market Size, By Region, 2017–2024 (USD Million)
Table 11 Supply Chain Analytics: Market Size, By Region, 2017–2024 (USD Million)
Table 12 Security Analytics: Market Size, By Region, 2017–2024 (USD Million)
Table 13 IT Operations Analytics: Market Size, By Region, 2017–2024 (USD Million)
Table 14 Others: Market Size, By Region, 2017–2024 (USD Million)
Table 15 Analytics as a Service Market Size, By Service, 2017–2024 (USD Million)
Table 16 Services: Market Size, By Region, 2017–2024 (USD Million)
Table 17 Managed Services: Market Size, By Region, 2017–2024 (USD Million)
Table 18 Professional Services: Market Size, By Region, 2017–2024 (USD Million)
Table 19 Consulting: Market Size, By Region, 2017–2024 (USD Million)
Table 20 Support and Maintenance: Market Size, By Region, 2017–2024 (USD Million)
Table 21 Analytics as a Service Market Size, By Deployment Mode, 2017–2024 (USD Million)
Table 22 Public Cloud: Market Size, By Region, 2017–2024 (USD Million)
Table 23 Private Cloud: Market Size, By Region, 2017–2024 (USD Million)
Table 24 Hybrid Cloud: Market Size, By Region, 2017–2024 (USD Million)
Table 25 Market Size, By Organization Size, 2017–2024 (USD Million)
Table 26 Small and Medium-Sized Enterprises: Market Size, By Region, 2017–2024 (USD Million)
Table 27 Large Enterprises: Market Size, By Region, 2017–2024 (USD Million)
Table 28 Analytics as a Service Market Size, By Industry Vertical, 2017–2024 (USD Million)
Table 29 Banking, Financial Services, and Insurance: Market Size, By Region, 2017–2024 (USD Million)
Table 30 Retail and Ecommerce: Market Size, By Region, 2017–2024 (USD Million)
Table 31 Telecommunications and IT: Market Size, By Region, 2017–2024 (USD Million)
Table 32 Healthcare and Life Sciences: Market Size, By Region, 2017–2024 (USD Million)
Table 33 Manufacturing: Market Size, By Region, 2017–2024 (USD Million)
Table 34 Government and Defense: Market Size, By Region, 2017–2024 (USD Million)
Table 35 Media and Entertainment: Market Size, By Region, 2017–2024 (USD Million)
Table 36 Other Verticals: Market Size, By Region, 2017–2024 (USD Million)
Table 37 Analytics as a Service Market Size, By Region, 2017–2024 (USD Million)
Table 38 North America: Market Size, By Component, 2017–2024 (USD Million)
Table 39 North America: Market Size, By Solution, 2017–2024 (USD Million)
Table 40 North America: Market Size, By Service, 2017–2024 (USD Million)
Table 41 North America: Market Size, By Professional Service, 2017–2024 (USD Million)
Table 42 North America: Market Size, By Deployment Mode, 2017–2024 (USD Million)
Table 43 North America: Market Size, By Organization Size, 2017–2024 (USD Million)
Table 44 North America: Market Size, By Industry Vertical, 2017–2024 (USD Million)
Table 45 North America: Market Size, By Country, 2017–2024 (USD Million)
Table 46 United States: Analytics as a Service Market Size, By Component, 2017–2024 (USD Million)
Table 47 Canada: Market Size, By Component, 2017–2024 (USD Million)
Table 48 Europe: Market Size, By Component, 2017–2024 (USD Million)
Table 49 Europe: Market Size, By Solution, 2017–2024 (USD Million)
Table 50 Europe: Market Size, By Service, 2017–2024 (USD Million)
Table 51 Europe: Market Size, By Professional Service, 2017–2024 (USD Million)
Table 52 Europe: Market Size, By Deployment Mode, 2017–2024 (USD Million)
Table 53 Europe: Market Size, By Organization Size, 2017–2024 (USD Million)
Table 54 Europe: Market Size, By Industry Vertical, 2017–2024 (USD Million)
Table 55 Europe: Market Size, By Country, 2017–2024 (USD Million)
Table 56 United Kingdom: Analytics as a Service Market Size, By Component, 2017–2024 (USD Million)
Table 57 Germany: Market Size, By Component, 2017–2024 (USD Million)
Table 58 France: Market Size, By Component, 2017–2024 (USD Million)
Table 59 Italy: Market Size, By Component, 2017–2024 (USD Million)
Table 60 Rest of Europe: Analytics as a Service Market Size, By Component, 2017–2024 (USD Million)
Table 61 Asia Pacific: Analytics as a Service Market Size, By Component, 2017–2024 (USD Million)
Table 62 Asia Pacific: Market Size, By Solution, 2017–2024 (USD Million)
Table 63 Asia Pacific: Market Size, By Service, 2017–2024 (USD Million)
Table 64 Asia Pacific: Market Size, By Professional Service, 2017–2024 (USD Million)
Table 65 Asia Pacific: Market Size, By Deployment Mode, 2017–2024 (USD Million)
Table 66 Asia Pacific: Market Size, By Organization Size, 2017–2024 (USD Million)
Table 67 Asia Pacific: Market Size, By Industry Vertical, 2017–2024 (USD Million)
Table 68 Asia Pacific: Market Size, By Country, 2017–2024 (USD Million)
Table 69 China: Analytics as a Service Market Size, By Component, 2017–2024 (USD Million)
Table 70 Japan: Market Size, By Component, 2017–2024 (USD Million)
Table 71 India: Market Size, By Component, 2017–2024 (USD Million)
Table 72 Rest of Asia Pacific: Market Size, By Component, 2017–2024 (USD Million)
Table 73 Middle East and Africa: Analytics as a Service Market Size, By Component, 2017–2024 (USD Million)
Table 74 Middle East and Africa: Market Size, By Solution, 2017–2024 (USD Million)
Table 75 Middle East and Africa: Market Size, By Service, 2017–2024 (USD Million)
Table 76 Middle East and Africa: Market Size, By Professional Service, 2017–2024 (USD Million)
Table 77 Middle East and Africa: Market Size, By Deployment Mode, 2017–2024 (USD Million)
Table 78 Middle East and Africa: Market Size, By Organization Size, 2017–2024 (USD Million)
Table 79 Middle East and Africa: Market Size, By Industry Vertical, 2017–2024 (USD Million)
Table 80 Middle East and Africa: Analytics as a Service Market Size, By Country, 2017–2024 (USD Million)
Table 81 Kingdom of Saudi Arabia: Market Size, By Component, 2017–2024 (USD Million)
Table 82 United Arab Emirates: Market Size, By Component, 2017–2024 (USD Million)
Table 83 South Africa: Market Size, By Component, 2017–2024 (USD Million)
Table 84 Rest of Middle East and Africa: Market Size, By Component, 2017–2024 (USD Million)
Table 85 Latin Anerica: Analytics as a Service Market Size, By Component, 2017–2024 (USD Million)
Table 86 Latin America: Market Size, By Solution, 2017–2024 (USD Million)
Table 87 Latin America: Market Size, By Service, 2017–2024 (USD Million)
Table 88 Latin America: Market Size, By Professional Service, 2017–2024 (USD Million)
Table 89 Latin Anerica: Market Size, By Deployment Mode, 2017–2024 (USD Million)
Table 90 Latin America: Market Size, By Organization Size, 2017–2024 (USD Million)
Table 91 Latin America: Market Size, By Industry Vertical, 2017–2024 (USD Million)
Table 92 Latin America: Market Size, By Country, 2017–2024 (USD Million)
Table 93 Brazil: Analytics as a Service Market Size, By Component, 2017–2024 (USD Million)
Table 94 Mexico: Market Size, By Component, 2017–2024 (USD Million)
Table 95 Argentina: Market Size, By Component, 2017–2024 (USD Million)
Table 96 Rest of Latin America: Market Size, By Component, 2017–2024 (USD Million)
Table 97 Evaluation Criteria
Table 98 Microsoft: Organic Growth Strategies
Table 99 Microsoft: Inorganic Growth Strategies
Table 100 Google: Organic Growth Strategies
Table 101 AWS: Organic Growth Strategies
Table 102 Oracle: Organic Growth Strategies
Table 103 Oracle: Inorganic Growth Strategies
Table 104 IBM: Organic Growth Strategies
Table 105 IBM: Inorganic Growth Strategies
Table 106 SAP: Organic Growth Strategies
Table 107 SAP: Inorganic Growth Strategies
Table 108 Teradata: Organic Growth Strategies
Table 109 Salesforce: Inorganic Growth Strategies
Table 110 TIBCO Software: Organic Growth Strategies
Table 111 TIBCO Software: Inorganic Growth Strategies
Table 112 SAS Institute: Organic Growth Strategies
Table 113 SAS Institute: Inorganic Growth Strategies
Table 114 Sisense: Organic Growth Strategies
Table 115 Sisense: Inorganic Growth Strategies
Table 116 Atos: Organic Growth Strategies
Table 117 HPE: Organic Growth Strategies
Table 118 HPE: Inorganic Growth Strategies
Table 119 Hitachi Ventara: Organic Growth Strategies
Table 120 Cloudera: Organic Growth Strategies
Table 121 Cloudera: Inorganic Growth Strategies
Table 122 Organic Growth Strategies
Table 123 ThoughtSpot: Organic Growth Strategies
Table 124 ThoughtSpot: Inorganic Growth Strategies
Table 125 Qlik: Organic Growth Strategies
Table 126 Qlik: Inorganic Growth Strategies
Table 127 Domo: Organic Growth Strategies
Table 128 Domo: Inorganic Growth Strategies
Table 129 GoodData: Organic Growth Strategies
Table 130 GoodData: Inorganic Growth Strategies
Table 131 Alteryx: Organic Growth Strategies
Table 132 Alteryx: Inorganic Growth Strategies
List of Figures (61 Figures)
Figure 1 Analytics as a Service Market: Research Design
Figure 2 Data Triangulation
Figure 3 Market Size Estimation Methodology: Approach 1 (Supply Side): Revenue of Solutions/Services of the Market
Figure 4 Market Size Estimation Methodology: Approach 1 Bottom-Up (Supply Side): Collective Revenue of All Solutions/Services of the Market
Figure 5 Market Size Estimation Methodology: Approach 2 Top-Down (Demand Side): Share of Analytics as a Service Through the Overall Analytics as a Service Spending
Figure 6 Analytics as a Service Market: Top-Down and Bottom-Up Approaches
Figure 7 Solutions Segment to Hold a Larger Market Size in 2019
Figure 8 Financial Analytics Segment to Hold the Highest Market Share in 2019
Figure 9 Professional Services Segment to Hold a Larger Market Size in 2019
Figure 10 Support and Maintenance Services Segment to Hold at a Higher Market Share in 2019
Figure 11 Public Cloud Segment to Hold the Highest Market Share in 2019
Figure 12 Large Enterprises Segment to Hold a Higher Market Share in 2019
Figure 13 Analytics as a Service Market Snapshot, By Industry Vertical
Figure 14 Market Snapshot, By Region
Figure 15 Enterprise Need to Adopt Advanced Analytical Capabilities With Minimal Infrastructure and Cost-Effectiveness Offered By Analytics as a Service Solutions are the Key Factors Driving the Overall Growth of the Market
Figure 16 Marketing Analytics Segment to Grow at the Highest CAGR During the Forecast Period
Figure 17 North America to Hold the Highest Market Share in 2019
Figure 18 Financial Analytics Solution and BFSI Industry Vertical Accounted for the Highest Shares in the Analytics as a Service Market in 2019
Figure 19 Market: Drivers, Restraints, Opportunities, and Challenges
Figure 20 Functional Elements of an Analytics as a Service Solution
Figure 21 Services Segment to Grow at a Higher CAGR During the Forecast Period
Figure 22 Marketing Analytics Segment to Grow at the Highest CAGR During the Forecast Period
Figure 23 Managed Services Segment to Grow at a Higher CAGR During the Forecast Period
Figure 24 Consulting Segment to Grow at a Higher CAGR During the Forecast Period
Figure 25 Hybrid Cloud Segment to Witness the Highest CAGR During the Forecast Period
Figure 26 Small and Medium-Sized Enterprises Segment to Grow at a Higher CAGR During the Forecast Period
Figure 27 Healthcare and Life Sciences Industry Vertical to Register the Highest CAGR During the Forecast Period
Figure 28 Asia Pacific to Hold the Highest CAGR During the Forecast Period
Figure 29 India to Account for the Highest CAGR During the Forecast Period
Figure 30 Asia Pacific to Account for the Highest CAGR During the Forecast Period
Figure 31 North America: Market Snapshot
Figure 32 Marketing Analytics Segment to Grow at the Highest CAGR During the Forecast Period in North America
Figure 33 Marketing Analytics Segment to Grow at the Highest CAGR During the Forecast Period in Europe
Figure 34 Asia Pacific: Market Snapshot
Figure 35 Marketing Analytics Segment to Grow at the Highest CAGR During the Forecast Period in Asia Pacific
Figure 36 Marketing Analytics Segment to Register the Highest CAGR During the Forecast Period in Middle East and Africa
Figure 37 Marketing Analytics Segment to Grow at the Highest CAGR During the Forecast Period in Latin America
Figure 38 Analytics as a Service Market (Global), Competitive Leadership Mapping, 2018
Figure 39 Microsoft: Company Snapshot
Figure 40 Microsoft: SWOT Analysis
Figure 41 Google: Company Snapshot
Figure 42 Google: SWOT Analysis
Figure 43 AWS: Company Snapshot
Figure 44 AWS: SWOT Analysis
Figure 45 Oracle: Company Snapshot
Figure 46 Oracle: SWOT Analysis
Figure 47 IBM: Company Snapshot
Figure 48 IBM: SWOT Analysis
Figure 49 SAP: Company Snapshot
Figure 50 Teradata: Company Snapshot
Figure 51 Teradata: SWOT Analysis
Figure 52 Salesforce: Company Snapshot
Figure 53 SAS Institute: Company Snapshot
Figure 54 SAS Institute: SWOT Analysis
Figure 55 Atos: Company Snapshot
Figure 56 HPE: Company Snapshot
Figure 57 Cloudera: Company Snapshot
Figure 58 Cloudera: SWOT Analysis
Figure 59 MicroStrategy: Company Snapshot
Figure 60 Domo: Company Snapshot
Figure 61 Alteryx: Company Snapshot
The study involved 4 major activities in estimating the current market size of the analytics as a service market. An extensive secondary research was done to collect information on the market, peer market, and the parent market. The next step was to validate these findings, assumptions, and sizing with industry experts across the value chain through primary research. Both top-down and bottom-up approaches were used to estimate the total market size. After that, the market breakup and data triangulation procedures were used to estimate the market size of the segments and subsegments of the analytics as a service market.
Secondary Research
In the secondary research process, various secondary sources, such as IEEE Journals and magazines and Journal of Cloud Computing, have been referred to, for identifying and collecting information for this study. Secondary sources included annual reports; press releases and investor presentations of companies; whitepapers, certified publications, and articles by recognized authors; Research and Development (R&D) organizations; regulatory bodies; and databases. Journals, repositories, and resources from the International Journal of Advanced Research in Computer Science, and Institute of Electrical and Electronics Engineers (IEEE) were referred to understand the integration of analytics as a service.
Primary Research
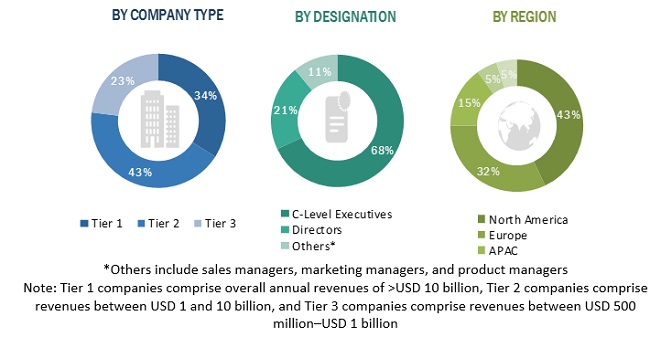
Various primary sources from both supply and demand sides were interviewed to obtain qualitative and quantitative information of the market. The primary sources from the supply side included various industry experts, such as Chief X Officers (CXOs), Vice Presidents (VPs), directors, from business development, marketing, product development/innovation teams, and related key executives from analytics as a service solution vendors, system integrators, professional service providers, industry associations, and analytics consultants and key opinion leaders. All possible parameters that affect the market covered in this research study have been accounted for, viewed in extensive detail, verified through primary research, and analyzed to get the final quantitative and qualitative data.
The following is the breakup of primary profiles:
To know about the assumptions considered for the study, download the pdf brochure
Market Size Estimation
Both top-down and bottom-up approaches were used to estimate and validate the total size of the analytics as a service market. The top-down approach was used to derive the revenue contribution of top vendors and their offerings in the market. The bottom-up approach was used to arrive at the overall market size of the global analytics as a service market using key companies’ revenue and their offerings in the market. The research methodology used to estimate the market size includes the following:
- The key players in the market were identified through extensive secondary research.
- The market size, in terms of value, was determined through primary and secondary research processes.
- All percentage, shares split, and breakups were determined using secondary sources and verified through primary sources.
Data Triangulation
After arriving at the overall market size using the market size estimation processes as explained above, the market was split into several segments and subsegments. To complete the overall market engineering process and arrive at the exact statistics of each market segment and subsegment, data triangulation and market breakup procedures were employed, wherever applicable. The overall market size was then used in the top-down procedure to estimate the size of other individual markets via percentage splits of the market segmentation.
Report Objectives
- To define, segment, and project the global market size for analytics as a service
- To understand the structure of the analytics as a service market by identifying its various subsegments
- To provide detailed information about the key factors influencing the growth of the market (drivers, restraints, opportunities, and industry-specific challenges)
- To analyze the micromarkets concerning individual growth trends, prospects, and their contribution to the overall market
- To project the size of the market and its submarkets, in terms of value, for the 5 regions (along with their respective key countries)
- To profile key players and comprehensively analyze their core competencies
- To understand the competitive landscape and identify significant growth strategies adopted by players across key regions
- To analyze competitive developments, such as expansions and fundings, new product launches, mergers and acquisitions, strategic partnerships, and agreements, in the analytics as a service market
Scope of the Report
|
Report Metrics |
Details |
|
Market size available for years |
2017–2024 |
|
Base year considered |
2018 |
|
Forecast period |
2019–2024 |
|
Forecast units |
Billion (USD) |
|
Segments covered |
Component, Deployment Mode, Organization Size, Industry Vertical, and Region |
|
Geographies covered |
North America, Europe, APAC, Latin America, and MEA |
|
Companies covered |
Microsoft (US), Teradata (US), IBM (US), Oracle (US), SAS Institute (US), Atos (France), Google (US), AWS (US), HPE (US), Hitachi Vantara (Japan), Salesforce (US), Cloudera (US), MicroStrategy (US), SAP (Germany), ThoughtSpot (US), Qlik (US), Domo (US), TIBCO Software (US), Sisense (US), GoodData (US), Birst (US), Yellowfin (Australia), Guavus (US), Absolutdata (US), Alteryx(US), Looker (US), Pyramid Analytics (Europe), and Board International (Switzerland) |
This research report categorizes the analytics as a service market based on components, deployment modes, organization size, verticals, and regions.
By component, the analytics as a service market is divided into the following segments:
-
Solutions
- Financial Analytics
- Risk Analytics
- Marketing Analytics
- Web Analytics
- Supply Chain Analytics
- Security Analytics
- IT Operations Analytics
- Others (HR Analytics and Legal Analytics)
-
Services
- Managed Services
-
Profession Services
- Consulting
- Support and Maintenance
By deployment mode, the analytics as a service market is divided into the following segments:
- Public Cloud
- Private Cloud
- Hybrid Cloud
By organization size, the market is divided into the following segments:
- Large Enterprises
- Small and Medium-sized Enterprises (SMEs)
By industry vertical, the analytics as a service market is divided into the following segments:
- Banking, Financial Services and Insurance (BFSI)
- Retail and eCommerce
- Telecommunication and IT
- Healthcare and Life Sciences
- Manufacturing
- Government and Defense
- Media and Entertainment
- Others (Energy and Utilities, Transportation and Logistics, Travel and Hospitality, and Education)
By region, the analytics as a service market is divided into the following segments:
-
North America
- US
- Canada
-
Europe
- UK
- Germany
- France
- Italy
- Rest of Europe
-
Asia Pacific (APAC)
- China
- Japan
- India
- Rest of APAC
-
Middle East and Africa (MEA)
- Kingdom of Saudi Arabia (KSA)
- UAE
- South Africa
- Rest of MEA*
-
Latin America
- Brazil
- Mexico
- Argentina
- Rest of Latin America*
Critical Questions the Report Answers
- What are the current trends driving the analytics as a service market?
- In which vertical are most industrial companies deploying AaaS solutions?
- Where will recent developments of market vendors take the industry in the mid- to long-term?
- Who are the top vendors in the AaaS market, and what is their competitive analysis?
- What are the drivers and challenges faced by vendors in the AaaS market?
Available customizations
With the given market data, MarketsandMarkets offers customizations as per the company’s specific needs. The following customization options are available for the report:
Product analysis
- Product matrix provides a detailed comparison of the product portfolio of each company
Geographic analysis
- Further breakup of the North American analytics as a service market
- Further breakup of the European market
- Further breakup of the APAC market
- Further breakup of the Latin American market
- Further breakup of the MEA market
Company information
- Detailed analysis and profiling of additional market players up to 5


Growth opportunities and latent adjacency in Analytics as a Service Market
Detailed understanding of the Analytics as a Service Market
Interested in the SMB and its revenue size.