Defoamers Market by Type (Water Based, Oil Based, and Silicone Based), Application (Pulp & paper, Oil & Gas, Food & Beverage, Paints & Coatings, Detergents, Pharmaceutical, Textiles, and Water Treatment) � Global Forecast to 2021


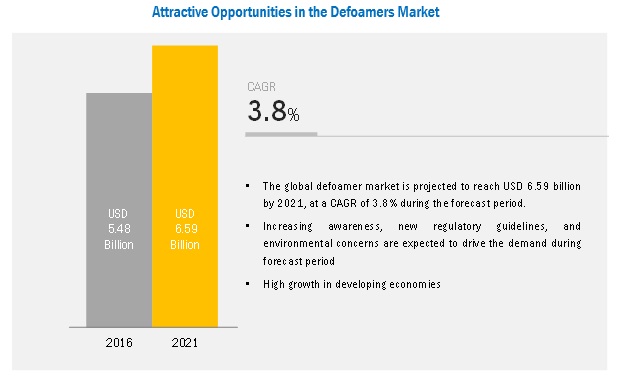
[170 Pages Report] The defoamers market size is estimated to be USD 5.48 billion in 2016 and is projected reach USD 6.59 billion by 2021, at a CAGR of 3.8% between 2016 and 2021. The growing manufacturing sector in all regions is expected to generate demand and drive the antifoaming agent market during the forecast period. Increasing awareness coupled with regulatory guidelines and environmental concerns are expected to drive the defoamers market during the forecast period. Asia-Pacific is the key market for defoamers, globally, followed by North America and Europe.
Silicone is expected to be largest type of defoamer during the forecast period
The defoamer market is classified based on type: water-based, oil-based, and silicone-based. The market is dominated by silicone-based due to their enhanced properties such as low surface tension, chemical inertness, thermal stability, and complete insolubility in water. The silicone-based segment is also projected to be the second fastest-growing type of defoamer during the forecast period.
Pulp & paper application is expected to dominate the market during the forecast period
The pulp & paper application dominated the defoamer market during the forecast period, closely followed by paints & coatings in 2015. Paints & coatings application is also expected to witness high growth rate between 2016 and 2021 due to the growing paints & coatings industry in North America, Europe, and Asia-Pacific, as a result increasing the demand for defoamer in the respective regions. The growing manufacturing industry in the U.S., the Middle East, and Asia-Pacific countries such as China, Japan, and India is also driving the market.
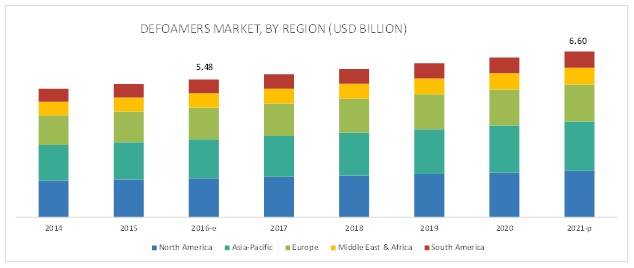
North America is expected to account for the largest share of the defoamers market during the forecast period.
Currently, North America is the largest defoamers market, in terms of value, closely followed by Asia-Pacific. Some of the factors driving the growth of the North American market are high growth of end-use industries, local manufacturing, and increased number of domestic players in various market segments.
Asia-Pacific is expected to be the fastest-growing defoamers market due to high demand from pulp & paper and paints & coatings applications. The presence of major countries such as China, India, and Japan is also a major driver of the defoamers market in the region.
Key Market Players
Air Products and Chemicals Inc. (U.S.), Dow Corning Corporation (U.S.), Evonik Industries (Germany), BASF (Germany), Kemira (Finland), Ashland (U.S.), Elements Plc. (U.K.), and Shin-Etsu Chemical Company Ltd. (Japan).
BASF is among the leading players in the defoamers market. The company is developing its defoamer segment by launching new products. BASF launched Efka PB 2744, a fast and effective defoamer for 100% solids coating systems, especially designed for industrial flooring formulations. The new product offers excellent efficiency, long-term persistency, and effectiveness against micro and macro foam. The company launched Efka 2010, for industrial coatings applications. Efka 2010 helps to achieve high-performance silicone-free defoaming. It is compatible with various systems, such as nitrocellulose/alkyd lacquers, 2k polyurethane, solid and acid-cured coatings, and cold-cured epoxy coatings.
Evonik Industries focuses on capacity expansion as their development strategy. Evonik, in a bid to meet rising demand of specialty silicone products in Asia, planned to construct a production facility in Shanghai, China, which is expected to be completed by mid-2017. Specialty silicones are generally used in car seats, furniture, and ergonomic mattresses. The company planned to expand its production capacity of specialty silicones plant in Germany to make its market presence strong. The demand for such products is mainly driven by textiles, coating, construction, and appliance & furniture industries.
Recent Developments
- In March 2016, Dow Corning Corporation launched Dow Corning 2405 resin, Dow Corning 8590 additive, and Dow Corning 3055 resin. These product deliver an adequate balance of pigment concentration level and foam control along with minimizing VOCs emission.
- In February 2016, Air products and chemicals Inc. launched Surfynol 107L. It is a non-foaming, surface active and nonionic wetting agent suitable for low-VOC formulations.
- In April 2016, with an investment of around USD 2.5 billion, Wacker Chemie AG inaugurated a new polysilicone manufacturing site in Tennessee (U.S.) with a production capacity of 20,000 metric tons
- In March 2016, Evonik, in a bid to meet rising demand of specialty silicone products in Asia, planned to construct a production facility in Shanghai, China, which is expected to be completed by mid-2017. Specialty silicones are generally used in car seats, furniture, and ergonomic mattresses.
Key Questions addressed by the report
- What are the major developments impacting the market?
- Where will all the developments take the industry in the mid to long term?
- What are the upcoming types of defoamers?
- What are the emerging applications of defoamers?
- What are the emerging end-use industries of defoamers?
- What are the major factors impacting market growth during the forecast period?
To speak to our analyst for a discussion on the above findings, click Speak to Analyst
Table of Contents
1 Introduction (Page No. - 16)
1.1 Objectives of the Study
1.2 Market Definition
1.3 Market Scope
1.3.1 Years Considered for the Study
1.4 Currency
1.5 Limitations
1.6 Stakeholders
2 Research Methodology (Page No. - 19)
2.1 Research Data
2.1.1 Secondary Data
2.1.1.1 Key Data From Secondary Sources
2.1.2 Primary Data
2.1.2.1 Key Data From Primary Sources
2.1.2.2 Key Industry Insights
2.1.2.3 Breakdown of Primary Interviews
2.2 Market Size Estimation
2.2.1 Bottom-Up Approach
2.2.2 Top-Down Approach
2.3 Data Triangulation
2.4 Research Assumptions
3 Executive Summary (Page No. - 27)
4 Premium Insights (Page No. - 31)
4.1 Significant Opportunities for the Antifoaming Agent Market
4.2 Antifoaming Agent Market, By Region, 2016–2021
4.3 Antifoaming Agent Market in North America, By Application and Country
4.4 Antifoaming Agent Market Attractiveness
4.5 Antifoaming Agent Market Share, By Type and Region, 2015
4.6 Life Cycle Analysis, By Region
5 Market Overview (Page No. - 36)
5.1 Introduction
5.2 Market Segmentation
5.2.1 Antifoaming Agent Market, By Type
5.2.2 Antifoaming Agent Market, By Application
5.3 Market Dynamics
5.3.1 Drivers
5.3.1.1 Increasing Awareness, New Regulatory Guidelines, and Environment Concerns
5.3.1.2 Rising Demand From Asia-Pacific
5.3.2 Restraints
5.3.2.1 High Loading Levels of Antifoaming Agent in the Industrial Process
5.3.3 Opportunities
5.3.3.1 Technological Advancements
5.3.3.2 Developing Effective and Low-Impact Chemicals
6 Industry Trends (Page No. - 41)
6.1 Introduction
6.2 Value-Chain Analysis
6.2.1 Raw Material
6.2.2 Antifoaming Agent Formulation
6.2.3 Distribution
6.2.4 End-Use Industry (Application)
6.3 Porter’s Five Forces Analysis
6.3.1 Threat of New Entrants
6.3.2 Threat of Substitutes
6.3.3 Bargaining Power of Suppliers
6.3.4 Bargaining Power of Buyers
6.3.5 Intensity of Competitive Rivalry
6.4 Economic Indicators
6.4.1 Oil & Gas Industry
6.4.2 Pulp & Paper
6.4.3 Manufacturing
6.4.4 Mining
7 Antifoaming Agent Market, By Type (Page No. - 51)
7.1 Introduction
7.2 Market Size and Projection
7.2.1 Water-Based Antifoaming Agent
7.2.2 Oil-Based Antifoaming Agent
7.2.3 Silicone–Based Antifoaming Agent
7.2.4 Other Antifoaming Agents (Eo-/Po-Based)
8 Antifoaming Agent Market, By Application (Page No. - 59)
8.1 Introduction
8.2 Market Size and Projection
8.2.1 Pulp & Paper
8.2.2 Oil & Gas
8.2.3 Paints & Coatings
8.2.4 Water Treatment
8.2.5 Detergents
8.2.6 Food & Beverage
8.2.7 Pharmaceutical
8.2.8 Textiles
8.2.9 Others
9 Antifoaming Agent Market, By Region (Page No. - 76)
9.1 Introduction
9.2 North America
9.2.1 U.S.
9.2.2 Canada
9.2.3 Mexico
9.3 Asia-Pacific
9.3.1 Indonesia
9.3.2 Australia
9.3.3 China
9.3.4 Japan
9.3.5 India
9.4 Europe
9.4.1 Germany
9.4.2 France
9.4.3 Spain
9.4.4 Sweden
9.4.5 Finland
9.4.6 Russia
9.5 Middle East & Africa
9.5.1 Uae
9.5.2 Nigeria
9.5.3 Saudi Arabia
9.5.4 South Africa
9.5.5 Iran
9.6 South America
9.6.1 Argentina
9.6.2 Colombia
9.6.3 Brazil
9.6.4 Venezuela
10 Competitive Landscape (Page No. - 117)
10.1 Overview
10.2 Competitive Benchmarking
10.3 Competitive Situations and Trends
10.3.1 New Product Launches
10.3.2 Expansions
10.3.3 Mergers & Acquisitions
10.3.4 Others
11 Company Profiles (Page No. - 126)
(Overview, Financial*, Products & Services, Strategy, and Developments)
11.1 BASF
11.2 Evonik Industries
11.3 Air Products and Chemicals, Inc.
11.4 Wacker Chemie AG
11.5 DOW Corning Corporation
11.6 Ecolab Inc. (Nalco)
11.7 Shin-Etsu Chemical Company Ltd.
11.8 Ashland Inc.
11.9 Kemira OYJ
11.10 Elementis PLC
11.11 Other Manufacturers of Antifoam Agent
11.12 List of Customers
*Details Might Not Be Captured in Case of Unlisted Companies.
12 Appendix (Page No. - 162)
12.1 Insights From Industry Experts
12.2 Discussion Guide
12.3 Knowledge Store: Marketsandmarkets’ Subscription Portal
12.4 Introducing RT: Real Time Market Intelligence
12.5 Available Customizations
12.6 Related Reports
List of Tables (81 Tables)
Table 1 Oil Production, By Region and Country, 2010–2014 (Million Ton)
Table 2 Antifoaming Agent Market Size, By Type, 2014–2021 (USD Million)
Table 3 Water-Based Antifoaming Agent Market Size, By Region, 2014–2021 (USD Million)
Table 4 Oil-Based Antifoaming Agent Market Size, By Region, 2014–2021 (USD Million)
Table 5 Silicone-Based Antifoaming Agent Market Size, By Region, 2014–2021 (USD Million)
Table 6 Other Antifoaming Agent Market Size, By Region, 2014–2021 (USD Million)
Table 7 Antifoaming Agent Market Size, By Application, 2014–2021 (USD Million)
Table 8 Antifoaming Agent Market Size, By Application, 2014–2021 (Kiloton)
Table 9 Antifoaming Agent Market Size in Pulp & Paper Application, By Region, 2014–2021 (USD Million)
Table 10 Antifoaming Agent Market Size in Pulp & Paper Application, By Region, 2014–2021 (Kiloton)
Table 11 Antifoaming Agent Market Size in Oil & Gas Application, By Region, 2014–2021 (USD Million)
Table 12 Antifoaming Agent Market Size in Oil & Gas Application, By Region, 2014–2021 (Kiloton)
Table 13 Antifoaming Agent Market Size in Paints & Coatings Application, By Region, 2014–2021 (USD Million)
Table 14 Antifoaming Agent Market Size in Paints & Coatings Application, By Region, 2014–2021 (Kiloton)
Table 15 Antifoaming Agent Market Size in Water Treatment Application, By Region, 2014–2021 (USD Million)
Table 16 Antifoaming Agent Market Size in Water Treatment Application, By Region, 2014–2021 (Kiloton)
Table 17 Antifoaming Agent Market Size in Detergent Application, By Region, 2014–2021 (USD Million)
Table 18 Antifoaming Agent Market Size in Detergent Application, By Region, 2014–2021 (Kiloton)
Table 19 Antifoaming Agent Market Size in Food & Beverage Application, By Region, 2014–2021 (USD Million)
Table 20 Antifoaming Agent Market Size in Food & Beverage Application, By Region, 2014–2021 (Kiloton)
Table 21 Antifoaming Agent Market Size in Pharmaceutical Application, By Region, 2014–2021 (USD Million)
Table 22 Antifoaming Agent Market Size in Pharmaceutical Application, By Region, 2014–2021 (Kiloton)
Table 23 Antifoaming Agent Market Size in Textile Application, By Region, 2014–2021 (USD Million)
Table 24 Antifoaming Agent Market Size in Textile Application, By Region, 2014–2021 (Kiloton)
Table 25 Antifoaming Agent Market Size in Other Applications, By Region, 2014–2021 (USD Million)
Table 26 Antifoaming Agent Market Size in Other Applications, By Region, 2014–2021 (Kiloton)
Table 27 Antifoaming Agent Market Size, By Region, 2014–2021 (USD Million)
Table 28 Antifoaming Agent Market Size, By Region, 2014–2021 (Kiloton)
Table 29 North America: Antifoaming Agent Market Size, By Type, 2014–2021 (USD Million)
Table 30 North America: Antifoaming Agent Market Size, By Application, 2014–2021 (USD Million)
Table 31 North America: Antifoaming Agent Market Size, By Application, 2014–2021 (Kiloton)
Table 32 North America: Antifoaming Agent Market Size, By Country, 2014–2021 (USD Million)
Table 33 North America: Antifoaming Agent Market Size, By Country, 2014–2021 (Kiloton)
Table 34 U.S.: Antifoaming Agent Market Size, By Application, 2014–2021 (USD Million)
Table 35 Canada: Antifoaming Agent Market Size, By Application, 2014–2021 (USD Million)
Table 36 Mexico: Antifoaming Agent Market Size, By Application, 2014–2021 (USD Million)
Table 37 Asia-Pacific: Antifoaming Agent Market Size, By Type, 2014–2021 (USD Million)
Table 38 Asia-Pacific: Antifoaming Agent Market Size, By Application, 2014–2021 (USD Million)
Table 39 Asia-Pacific: Antifoaming Agent Market Size, By Application, 2014–2021 (Kiloton)
Table 40 Asia-Pacific: Antifoaming Agent Market Size, By Country, 2014–2021 (USD Million)
Table 41 Asia-Pacific: Antifoaming Agent Market Size, By Country, 2014–2021 (Kiloton)
Table 42 China: Antifoaming Agent Market Size, By Application, 2014–2021 (USD Million)
Table 43 Japan: Antifoaming Agent Market Size, By Application, 2014–2021 (USD Million)
Table 44 India: Antifoaming Agent Market Size, By Application, 2014–2021 (USD Million)
Table 45 Europe: Antifoaming Agent Market Size, By Country, 2014–2021 (USD Million)
Table 46 Europe: Antifoaming Agent Market Size, By Country, 2014–2021 (Kiloton)
Table 47 Europe: Antifoaming Agent Market Size, By Type, 2014–2021 (USD Million)
Table 48 Europe: Antifoaming Agent Market Size, By Application, 2014–2021 (USD Million)
Table 49 Europe: Antifoaming Agent Market Size, By Application, 2014–2021 (Kiloton)
Table 50 Sweden: Antifoaming Agent Market Size, By Application, 2014–2021 (USD Million)
Table 51 Finland: Antifoaming Agent Market Size, By Application, 2014–2021 (USD Million)
Table 52 Russia: Antifoaming Agent Market Size, By Application, 2014–2021 (USD Million)
Table 53 Middle East & Africa: Antifoaming Agent Market Size, By Country, 2014–2021 (USD Million)
Table 54 Middle East & Africa: Antifoaming Agent Market Size, By Country, 2014–2021 (Kiloton)
Table 55 Middle East & Africa: Antifoaming Agent Market Size, By Type, 2014–2021 (USD Million)
Table 56 Middle East & Africa: Antifoaming Agent Market Size, By Application, 2014–2021 (USD Million)
Table 57 Middle East & Africa: Antifoaming Agent Market Size, By Application, 2014–2021 (Kiloton)
Table 58 Saudi Arabia: Antifoaming Agent Market Size, By Application, 2014–2021 (USD Million)
Table 59 South Africa: Antifoaming Agent Market Size, By Application, 2014–2021 (USD Million)
Table 60 Iran: Antifoaming Agent Market Size, By Application, 2014–2021 (USD Million)
Table 61 South America: Antifoaming Agent Market Size, By Country, 2014–2021 (USD Million)
Table 62 South America: Antifoaming Agent Market Size, By Country, 2014–2021 (Kiloton)
Table 63 South America: Antifoaming Agent Market Size, By Type, 2014–2021 (USD Million)
Table 64 South America: Antifoaming Agent Market Size, By Application, 2014–2021 (USD Million)
Table 65 South America: Antifoaming Agent Market Size, By Application, 2014–2021 (Kiloton)
Table 66 Brazil: Antifoaming Agent Market Size, By Application, 2014–2021 (USD Million)
Table 67 Venezuela: Antifoaming Agent Market Size, By Application, 2014–2021 (USD Million)
Table 68 New Product Launches, 2012–2016
Table 69 Expansions, 2012–2016
Table 70 Mergers & Acquisitions, 2012–2016
Table 71 Others, 2012–2016
Table 72 BASF SF: Products and Description
Table 73 Evonik Industries: Products and Description
Table 74 Air Products and Chemicals, Inc.: Products and Description
Table 75 Wacker Chemie Ag: Products and Description
Table 76 DOW Corning Corporation: Products and Description
Table 77 Ecolab Inc. (Nalco): Products and Description
Table 78 Shin-Etsu Chemical Co., Ltd.: Products and Description
Table 79 Ashland Inc.: Products and Description
Table 80 Kemira: Products and Description
Table 81 Elementis PLC: Products and Description
List of Figures (70 Figures)
Figure 1 Antifoaming Agent Market: Research Design
Figure 2 Market Size Estimation: Bottom-Up Approach
Figure 3 Market Size Estimation: Top-Down Approach
Figure 4 Data Triangulation
Figure 5 Silicone-Based Antifoams to Continue Dominating the Antifoaming Agent Market
Figure 6 Pulp & Paper is the Largest Application for Antifoaming Agent Market
Figure 7 Asia-Pacific to Be the Fastest-Growing Market for Antifoaming Agent Market, 2016–2021
Figure 8 High Growth in the Antifoaming Agent Market Between 2016 and 2021
Figure 9 Asia-Pacific to Be the Largest Market for Antifoaming Agent
Figure 10 Silicone-Based Accounted for the Largest Market Share in North America in 2015
Figure 11 Rapid Industrialization in Emerging Regions is Driving the Demand for Antifoaming Agent Between 2016 and 2021
Figure 12 Silicone Based is the Largest Type of Antifoaming Agent Used Worldwide
Figure 13 Asia-Pacific to Be the Fastest-Growing Market of Antifoaming Agent
Figure 14 Overview of the Forces Governing the Antifoaming Agent Market
Figure 15 Value Chain of the Antifoaming Agent Market
Figure 16 Porter’s Five Forces Analysis
Figure 17 Oil Production, By Region, 2013–2014
Figure 18 Pulp & Paper Production, 2014
Figure 19 Country Wise Pulp & Paper Production, 2014
Figure 20 Manufacturing Industry Growth Rate, 2015
Figure 21 Silicone-Based Antifoaming Agent is Projected to Dominate the Market
Figure 22 Asia-Pacific to Be the Largest Market of Water-Based Antifoaming Agent
Figure 23 North America to Be the Second-Largest Market of Oil-Based Antifoaming Agent
Figure 24 North America and Asia-Pacific to Dominate the Silicone-Based Antifoaming Agent Market
Figure 25 Europe is the Third-Largest Market for Other Antifoaming Agents
Figure 26 Pulp & Paper Application to Dominate Antifoaming Agent Market
Figure 27 Asia-Pacific to Be the Fastest Growing Antifoaming Agent Market for Pulp & Paper Application
Figure 28 Middle East & Africa to Be the Largest Antifoaming Agent Market for Oil & Gas Application
Figure 29 Asia-Pacific to Be the Largest Antifoaming Agent Market for Paints & Coatings Application
Figure 30 Europe to Be the Second-Largest Antifoaming Agent Market for Water Treatment Application
Figure 31 North America to Be the Second-Largest Antifoaming Agent Market for Detergent Application
Figure 32 North America to Be the Largest Antifoaming Agent Market for Food & Beverage Application
Figure 33 Europe to Be the Second-Largest Antifoaming Agent Market for Pharmaceutical Application
Figure 34 Asia-Pacific to Be the Largest Antifoaming Agent Market in Textile Application
Figure 35 Asia-Pacific to Be the Largest Antifoaming Agent Market in Other Applications
Figure 36 Regional Snapshot (2016–2021): India Emerging as A Strategic Location for the Antifoaming Agent Market
Figure 37 Asia-Pacific to Be the Largest Market for Antifoaming Agent
Figure 38 U.S. to Be the Largest Market for Antifoaming Agent in North America
Figure 39 Asia-Pacific Market Snapshot: China to Dominate the Asia-Pacific Antifoaming Agent Market
Figure 40 Oil & Gas Application to Drive the Antifoaming Agent Market in Indonesia
Figure 41 Pulp & Paper Application to Drive the Antifoaming Agent Market in Australia
Figure 42 Paints & Coatings Application is Projected to Drive the Antifoaming Agent Market in Germany
Figure 43 Pulp & Paper Application to Generate Demand for Antifoaming Agent in France
Figure 44 Paints & Coatings Application is Expected to Drive the Antifoaming Agent Market in Spain
Figure 45 Oil & Gas Application is Projected to Drive the Antifoaming Agent Market in Uae
Figure 46 Oil & Gas Application is Projected to Drive the Antifoaming Agent Market in Nigeria
Figure 47 Food & Beverage Industry is Projected to Drive the Antifoaming Agent Market in Argentina
Figure 48 Pulp & Paper Application is Projected to Drive the Antifoaming Agent Market in Colombia
Figure 49 New Product Launches Was the Most Preferred Growth Strategy Adopted By Major Players Between 2012 and 2016
Figure 50 Key Growth Strategies in the Antifoaming Agent Market, 2012–2016
Figure 51 BASF: Company Snapshot
Figure 52 BASF: SWOT Analysis
Figure 53 Evonik Industries: Company Snapshot
Figure 54 Evonik Industries: SWOT Analysis
Figure 55 Air Products and Chemicals, Inc.: Company Snapshot
Figure 56 Air Products and Chemicals, Inc.: SWOT Analysis
Figure 57 Wacker Chemie AG: Company Snapshot
Figure 58 Wacker Chemie AG: SWOT Analysis
Figure 59 DOW Corning Corporation: Company Snapshot
Figure 60 DOW Corning Corporation: SWOT Analysis
Figure 61 Ecolab Inc. (Nalco): Company Snapshot
Figure 62 Ecolab Inc. (Nalco): SWOT Analysis
Figure 63 Shin-Etsu Chemical Company Ltd.: Company Snapshot
Figure 64 Shin-Etsu Chemical Co., Ltd.: SWOT Analysis
Figure 65 Ashland Inc.: Company Snapshot
Figure 66 Ashland Inc.: SWOT Analysis
Figure 67 Kemira OYJ: Company Snapshot
Figure 68 Kemira OYJ: SWOT Analysis
Figure 69 Elementis PLC: Company Snapshot
Figure 70 Elementis PLC: SWOT Analysis
The study involved four major activities in estimating the market size for defoamers. Exhaustive secondary research was done to collect information on the market, the peer market, and the parent market. The next step was to validate these findings, assumptions, and sizing with industry experts across the value chain through primary research. Both top-down and bottom-up approaches were employed to estimate the complete market size. Thereafter, the market breakdown and data triangulation procedures were used to estimate the market size of the segments and sub-segments.
Secondary Research
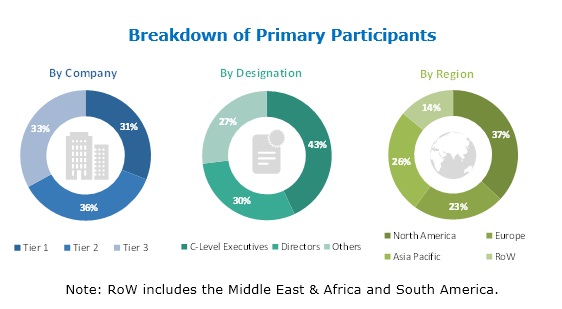
Secondary sources used in this study included annual reports, press releases, and investor presentations of companies; white papers; certified publications; articles from recognized authors; and gold standard & silver standard websites such as Factiva, ICIS, Bloomberg, and others. Findings of this study were verified through primary research by conducting extensive interviews with key officials such as CEOs, VPs, directors, and other executives. The breakdown of profiles of the primary interviewees is illustrated in the figure below:
Primary Research
The defoamers market comprises several stakeholders such as raw material suppliers, end-product manufacturers, and regulatory organizations in the supply chain. The demand side of this market is characterized by the development of the oil & gas, construction, manufacturing, healthcare/medical, mining, and other industries. The supply side is characterized by advancements in technology and diverse application industries. Various primary sources from both the supply and demand sides of the market were interviewed to obtain qualitative and quantitative information.
To know about the assumptions considered for the study, download the pdf brochure
Market Size Estimation
Both top-down and bottom-up approaches were used to estimate and validate the total size of the defoamers market. These methods were also used extensively to estimate the size of various sub-segments in the market. The research methodology used to estimate the market size includes the following:
The key players in the industry were identified through extensive secondary research.
- The industry’s value chain and market size, in terms of value, were determined through primary and secondary research processes.
- All percentage shares, splits, and breakdowns were determined using secondary sources and verified through primary sources.
Data Triangulation
After arriving at the overall market size-using the market size estimation processes as explained above-the market was split into several segments and sub-segments. In order to complete the overall market engineering process and arrive at the exact statistics of each market segment and sub-segment, the data triangulation and market breakdown procedures were employed, wherever applicable. The data was triangulated by studying various factors and trends from both the demand and supply sides in the oil & gas, construction, manufacturing, healthcare/medical, mining, and other industries.
Research objectives:
- To analyze and forecast the size of the global defoamers market, in terms of value and volume
- To define, describe, and forecast the global defoamers market by application, type, and region
- To forecast the size, in terms of value and volume, of the global defoamers market and its different submarkets in five regions, namely, Asia-Pacific, Europe, North America, the Middle East & Africa, and South America
- To identify significant trends and factors driving or inhibiting the growth of the market
- To analyze opportunities in the market for stakeholders by identifying the high-growth segments of the market
- To analyze competitive developments such as expansions, contracts & agreements, joint ventures, and new product launches in the defoamers market.
- To strategically profile the key players and comprehensively analyze their growth strategies
Scope of The Report:
|
Report Metric |
Details |
|
|
|
|
|
|
|
|
|
|
|
|
|
|
This report categorizes the global defoamer market based on type, application, and region.
Market Segmentation, by Type
The defoamer market has been segmented based on type:
- Water-based
- Oil-based
- Silicone-based
- Others (Ethylene Oxide and Propylene Oxide)
Market Segmentation, by Application
The defoamer market has been segmented based on application:
- Pulp & Paper
- Oil & Gas
- Paints & Coatings
- Water Treatment
- Food & Beverages
- Detergents
- Pharmaceuticals
- Textiles
- Others (Lubricants and Agrochemicals)
Market Segmentation, by Region
The regional analysis covers:
- North America
- Europe
- Asia-Pacific
- Middle East & Africa
- South America
Available Customizations
With the given market data, MarketsandMarkets offers customizations according to the company’s specific needs. The following customization options are available for the report:
Product Analysis
- Product Matrix that gives a detailed comparison of product portfolio of each company
Regional Analysis
- Further breakdown of a region with respect to a particular country
Company Information
- Detailed analysis and profiling of additional market players (Up to 5)


Growth opportunities and latent adjacency in Defoamers Market