Power Device Analyzer Market

Power Device Analyzer Market by Type (Both AC and DC, AC and DC), Current (Below 1000A and Above 1000A), End user (Automotive, Energy, Telecommunication, Consumer Electronics and Appliances, Medical) and Region - Global Forecast to 2027

Report Code: EP 7521 Jan, 2023, by marketsandmarkets.com

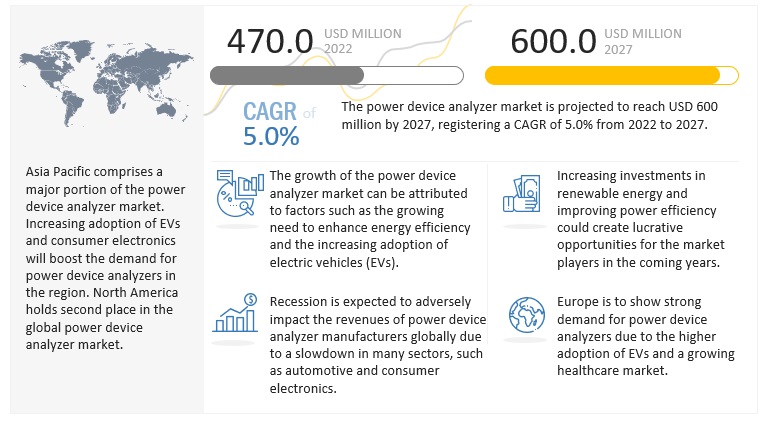
[193 Pages Report] The global power device analyzer market in terms of revenue was estimated to worth $470 million in 2022 and is poised to reach $600 million by 2027, growing at a CAGR of 5.0 % from 2022 to 2027. Power device analyzer is been widely used in various industries and is having a robust growth.
Power Device Analyzer Market

To know about the assumptions considered for the study, Request for Free Sample Report

Market Map

Power Device Analyzer Market

To know about the assumptions considered for the study, download the pdf brochure

Power Device Analyzer Market Dynamics

Driver: Increasing adoption of power-efficient devices across various industries

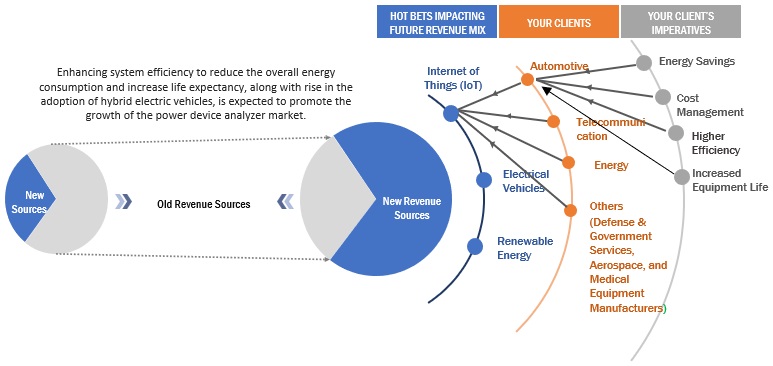
Energy savings is a major concern for every industry. Thus, there has been a constant development of technologies across all industries to achieve greater efficiency and save energy. Furthermore, there is an emerging demand for integrating new-age technologies with the industries to get real-time data and achieve greater efficiency, ultimately saving energy. For example, emerging economies such as China, India, and Brazil are witnessing growth in consumer electronics products with the advent of Internet of Things (IoT) and 5G technologies. The increased demand for smart technology-enabled electronic devices with improved functionalities has led to the development of power-efficient and high-performance consumer electronic products. New age power device analyzers come with detection technology that can provide harmonic distortion readings, comprehensive power quality readings, and three-dimensional charts. These features help ensure a better power supply, thus protecting equipment from future damage and increasing their lifetime. The power device analyzer market thus leverages the increasing adoption of high-efficiency systems.

Restraints: Expanding grey market

The supply of the power device analyzer is very much strong in the gray market as the cost of the branded device is more than the one which is manufactured locally. Because of this major players in the power device analyzer market face a competition from unknown players who sell in the gray market. These unknowns players in the market are gray market and the local players. These gray market players usually import the goods and sell it through an unauthorized dealer, whereas local players manufacture goods in house and sell it with their local name. Big players face problems such as price, competitiveness, and local supply from these unknown players as it is difficult for them to maintain and achieve. Apart from this many small scale and medium scale industries prefer to buy goods from local players mainly in developing countries because of the reduced cost. This reduces the opportunities for global players. These factors affect the growth of the branded power device analyzer manufacturers

Opportunities: Growing market for IoT devices to boost the demand for power device analyzers

In the past five years, global internet penetration has risen at a tremendous pace. The emergence of IoT and smart applications platforms is an important factor for the general growth of the power device analyzer industry. With the help of technologies, the variation has been created in IoT-enabled devices, such as smartphones, smart TVs, smart ACs, and other electronic gadgets. These emerging IoT technologies require proper testing and equipment measuring facilities. Therefore, IoT-enabled devices are driving the growth of the power device analyzer market as devices based on these technologies need to be tested to ensure that they can communicate and interoperate seamlessly. IoT-enabled devices are expensive and are used in various end user sectors, such as automobile, healthcare, and aerospace and defense. The use of IoT-enabled devices at these end user industries present significant growth opportunities for the test and measurement companies due to specific and strict standards of accuracy, reliability, latency, and availability to be met by them.

Challenges: Requirement of skilled personnel to operate power device analyzers

Power device analyzer requires high skilled personnel with a strong technical background to operate and access the testing or optimize the power conversion system. These analyzers test devices that transform, generate, or consume electricity and measure parameters, such as current, voltage, power, harmonics, and phase. These will require a technically skilled person to understand the methodologies to conduct the tasks. According to the Talent Shortage Survey, ~44% of employers worldwide report that they cannot find the skills they need in people to employ them. So, developing and underdeveloped countries such as Madagascar, Central African Republic, Niger, Nigeria, Cuba, Ecuador, and Guyana from Africa and South America that have a shortage of skilled personnel in the industries will restrain the market’s growth. For instance, in January 2018, according to the Department of Labor, the US economy had 7.6 million unfilled jobs, but only 6.5 million people were looking for work. This shortage of skilled workers is a major restraint for the growth of the power device analyzer market.

Market Trend
Power Device Analyzer Market Size, and Share

By type, Both AC and DC segment is predicted to have the highest CAGR of 5.1% in the power device analyzer market in the period of 2022 to 2027.

Both AC and DC type segment is predicted to have the highest growth rate in the power device analyzer market by type in forecasted period of 2022 – 2027. It is also estimated to account the greatest share in the market. The factors such as rising government initiatives for implementation of energy audits and mandatory regulations , increased demand for Electric Vehicles are positively influencing the both AC & DC segment in type of power device analyzer market.

By current, the below 1000A segment is predicted to have the highest CAGR of 5.2% in the power device analyzer market in the period of 2022 to 2027.

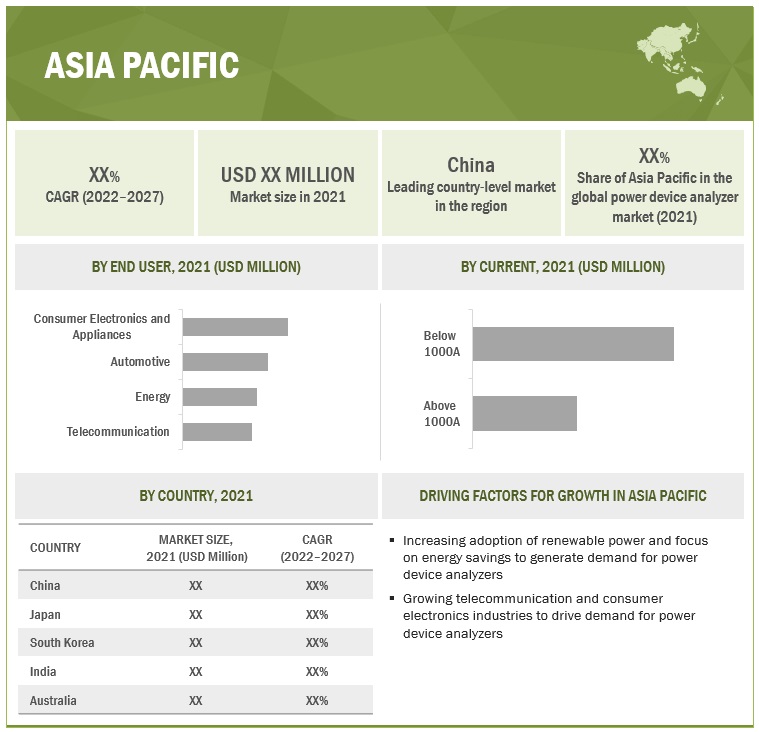
The below 1000A segment is estimated to have a highest growth rate by current in the power device analyzer market for the forecasted period 2022 – 2027. They also account for the greatest market share. Most of the industries uses below 1000A power device analyzers. Industries like Energy, aerospace & defense, automotive, healthcare equipment manufacturing and wireless communication. The automotive industry widely uses power device analyzers of below 1000A.

By end user, the consumer electronics and appliances segment is predicted to have the highest CAGR of 5.2% in the power device analyzer market in the period of 2022 to 2027.

The consumer electronics and appliances is predicted to have the highest CAGR in the power device analyzer market. Top companies witnessed an increase in demand for consumer electronics, such as air conditioners, smartphones, refrigerators, laptops, smart TVs, and smartwatches, reflecting significant growth in the consumer electronic sector. According to India Brand Equity Foundation (IBEF), the consumer electronics and appliances industry is expected to double to reach USD 21.18 billion by 2025. Thus, an increase in sales of the consumer appliances will require power device analyzers Thereby driving the power device analyzer market.

Asia Pacific has the highest market share in the power device analyzer market

Asia pacific is predicted to have a highest CAGR among other regions with the highest market share of 54.3%. The increased adoption of clean energy and focus towards energy savings are driving the power device analyzer market in this region. The growth of industries such as consumer electronics and automotive are expected to influence the market.
Power Device Analyzer Market Size, and Share

Key Market Players

The major players in the power device analyzer market include Keysight Technologies (US), Fluke Corporation (US), Yokogawa (Japan), Iwatsu (Japan), and Hioki E E Corporation (Japan).

Get online access to the report on the World's First Market Intelligence Cloud

  • Easy to Download Historical Data & Forecast Numbers
  • Company Analysis Dashboard for high growth potential opportunities
  • Research Analyst Access for customization & queries
  • Competitor Analysis with Interactive dashboard
  • Latest News, Updates & Trend analysis
Request Sample

Scope of the Report

Report Metric

Details

Market Size available for years

2019–2027

Base year considered

2021

Forecast period

2022–2027

Forecast units

Value (USD Million)

Segments covered

By Type, Current, and End user 

Geographies covered

Asia Pacific, North America, Middle East & Africa, South America, and Europe

Companies covered

Fluke Corporation (US), Keysight Technologies (US), Yokogawa Electric Corporation (Japan), Iwatsu Electric (Japan), Hioki E E Corporation (Japan), Newtons4th (UK), Rohde & Schwarz (Germany), Carlo Gavazzi (Switzerland), Vitrek (US), Circutor (Spain), ZES ZIMMER Electronic Systems (Germany), Texas Instruments (US), PCE Instruments (UK), Extech Instruments (US), Dewetron (Austria), Magtrol (US), Dewesoft D O O (Slovenia), Janitza Electronics (Germany), Arbiter Systems (US), Valhalla Scientific (US)

This research report categorizes the power device analyzer market based by type, current, and end user.

Based on type, the power device analyzer market has been segmented as follows:
  • Both AC and DC
  • AC
  • DC
Based on Current, the power device analyzer market has been segmented as follows:
  • Below 1000 A
  • Above 1000 A
Based on End user, the power device analyzer market has been segmented as follows:
  • Automotive
  • Energy
  • Telecommunication
  • Consumer Electronics and Appliances
  • Medical
  • Others – Aerospace, Defence and Government services
Based on the region, the power device analyzer market has been segmented as follows:
  • North America
  • Asia Pacific
  • Europe
  • South America
  • Middle East & Africa

Recent Developments

  • In May 2021, Iwatsu launched Curve Tracer CS-8000 series. The series can test up to 5kV, 2000A.
  • In December 2020, Keysight introduced N6705C DC power analyzer. For greater convenience, all sourcing and measuring functions are available from the front panel. Keysight now offers a recessed binding post (RBP) option with the N6705C for added safety when using banana plugs.
  • In October 2020, Yokogawa Electric Corporation was awarded a contract by Oman government to supply an analyzer package solution for Liwa Plastics Industries Complex that is being built for Oman Oil Refineries and Petroleum Industries Company.
  • In March 2019, ROHDE & SCHWARZ was awarded a contract by University of Aalborg to supply test equipment for the Electronic Engineering IoT living laboratory which includes oscilloscope, power analyzer, and radio scanner.

Frequently Asked Questions (FAQ):

To speak to our analyst for a discussion on the above findings, click Speak to Analyst

TABLE OF CONTENTS
 
1 INTRODUCTION (Page No. - 20)
    1.1 STUDY OBJECTIVES 
    1.2 DEFINITION 
    1.3 MARKET SCOPE 
           1.3.1 MARKET SEGMENTATION
                    TABLE 1 POWER DEVICE ANALYZER MARKET, BY TYPE: INCLUSIONS & EXCLUSIONS
                    TABLE 2 MARKET, BY END USER: INCLUSIONS & EXCLUSIONS
                    TABLE 3 MARKET, BY CURRENT: INCLUSIONS & EXCLUSIONS
           1.3.2 REGIONAL SCOPE
           1.3.3 YEARS CONSIDERED
    1.4 CURRENCY CONSIDERED 
    1.5 LIMITATIONS 
    1.6 STAKEHOLDERS 
    1.7 SUMMARY OF CHANGES 
           1.7.1 IMPACT OF RECESSION
 
2 RESEARCH METHODOLOGY (Page No. - 26)
    2.1 RESEARCH DATA 
           FIGURE 1 POWER DEVICE ANALYZER MARKET: RESEARCH DESIGN
    2.2 MARKET BREAKDOWN AND DATA TRIANGULATION 
           FIGURE 2 DATA TRIANGULATION METHODOLOGY
           2.2.1 SECONDARY DATA
                    2.2.1.1 Key data from secondary sources
           2.2.2 PRIMARY DATA
                    2.2.2.1 Key data from primary sources
                    2.2.2.2 Breakdown of primaries
                               FIGURE 3 BREAKDOWN OF PRIMARY INTERVIEWS: BY COMPANY TYPE, DESIGNATION, AND REGION
    2.3 RESEARCH SCOPE 
           FIGURE 4 METRICS CONSIDERED WHILE ANALYZING AND ASSESSING DEMAND FOR POWER DEVICE ANALYZERS
    2.4 MARKET SIZE ESTIMATION 
           2.4.1 BOTTOM-UP APPROACH
                    FIGURE 5 MARKET SIZE ESTIMATION METHODOLOGY: BOTTOM-UP APPROACH
           2.4.2 TOP-DOWN APPROACH
                    FIGURE 6 MARKET SIZE ESTIMATION METHODOLOGY: TOP-DOWN APPROACH
           2.4.3 DEMAND-SIDE ANALYSIS
                    2.4.3.1 Power device analyzer market: Industry/country analysis
           2.4.4 SUPPLY-SIDE ANALYSIS
                    FIGURE 7 MAIN METRICS CONSIDERED IN ASSESSING SUPPLY FOR MARKET
                    FIGURE 8 MARKET: SUPPLY-SIDE ANALYSIS
                    2.4.4.1 Assumptions for supply-side analysis
                    2.4.4.2 Supply-side calculation
                               FIGURE 9 INDUSTRY CONCENTRATION, 2021
    2.5 FORECAST 
    2.6 MARKET ANALYSIS OF RECESSION IMPACT 
 
3 EXECUTIVE SUMMARY (Page No. - 37)
    TABLE 4 SNAPSHOT OF POWER DEVICE ANALYZER MARKET 
    FIGURE 10 BOTH AC AND DC SEGMENT EXPECTED TO LEAD MARKET DURING FORECAST PERIOD 
    FIGURE 11 BELOW 1000A SEGMENT EXPECTED TO LEAD MARKET DURING FORECAST PERIOD 
    FIGURE 12 AUTOMOTIVE SEGMENT EXPECTED TO ACQUIRE LARGER MARKET SHARE OF MARKET DURING FORECAST PERIOD 
    FIGURE 13 ASIA PACIFIC DOMINATED MARKET IN 2021 
 
4 PREMIUM INSIGHTS (Page No. - 41)
    4.1 ATTRACTIVE OPPORTUNITIES FOR PLAYERS IN MARKET 
           FIGURE 14 RISING NEED FOR ENERGY EFFICIENCY TO DRIVE MARKET
    4.2 ASIA PACIFIC: MARKET, BY END USER AND COUNTRY 
           FIGURE 15 AUTOMOTIVE SEGMENT AND CHINA DOMINATED MARKET IN ASIA PACIFIC IN 2021
    4.3 MARKET, BY TYPE, 2021 
           FIGURE 16 BOTH AC AND DC SEGMENT TO DOMINATE MARKET DURING FORECAST PERIOD
    4.4 MARKET, BY CURRENT, 2021 
           FIGURE 17 BELOW 1000A SEGMENT TO DOMINATE MARKET DURING FORECAST PERIOD
    4.5 MARKET, BY END USER, 2021 
           FIGURE 18 AUTOMOTIVE END USER SEGMENT TO HOLD LARGEST MARKET SHARE DURING FORECAST PERIOD
    4.6 MARKET, BY REGION 
           FIGURE 19 ASIA PACIFIC, SOUTH AMERICA, AND NORTH AMERICA TO BE FASTEST-GROWING MARKETS FOR POWER DEVICE ANALYZERS DURING FORECAST PERIOD
 
5 MARKET OVERVIEW (Page No. - 45)
    5.1 INTRODUCTION 
    5.2 MARKET DYNAMICS 
           FIGURE 20 POWER DEVICE ANALYZER MARKET: DRIVERS, RESTRAINTS, OPPORTUNITIES, AND CHALLENGES
           5.2.1 DRIVERS
                    5.2.1.1 Rising focus on energy savings
                               FIGURE 21 INVESTMENTS IN ENERGY EFFICIENCY BY REGION, 2014–2018
                    5.2.1.2 Increasing adoption of power-efficient devices across various industries
                    5.2.1.3 Growth of electric vehicles market
                               FIGURE 22 GLOBAL EV (CARS) SALES, 2016–2020 (UNITS)
           5.2.2 RESTRAINTS
                    5.2.2.1 Expanding gray market
           5.2.3 OPPORTUNITIES
                    5.2.3.1 Growing focus on energy audits and regulations
                    5.2.3.2 Increasing adoption of power device analyzers by renewable energy sectors
                    5.2.3.3 Growing market for IoT devices
                               FIGURE 23 TRADE FLOW BY ICT GOODS CATEGORY (USD MILLION)
           5.2.4 CHALLENGES
                    5.2.4.1 High initial cost of installation
                    5.2.4.2 Requirement of skilled personnel
    5.3 TRENDS/DISRUPTIONS IMPACTING CUSTOMERS’ BUSINESSES 
           5.3.1 REVENUE SHIFT AND NEW REVENUE POCKETS FOR POWER DEVICE ANALYZER PROVIDERS
                    FIGURE 24 REVENUE SHIFT FOR POWER DEVICE ANALYZER MARKET
    5.4 PRICING ANALYSIS 
           TABLE 5 PRICING ANALYSIS OF POWER DEVICE ANALYZERS
    5.5 MARKET MAP 
           TABLE 6 POWER DEVICE ANALYZER MARKET: ECOSYSTEM
           FIGURE 25 MARKET MAP/ECOSYSTEM
    5.6 VALUE/SUPPLY CHAIN ANALYSIS 
           FIGURE 26 MARKET VALUE CHAIN ANALYSIS
           5.6.1 RAW MATERIAL/COMPONENT PROVIDERS
           5.6.2 POWER DEVICE ANALYZER MANUFACTURERS
           5.6.3 DISTRIBUTORS AND AFTER-SALES SERVICES
           5.6.4 END USERS
    5.7 TECHNOLOGY ANALYSIS 
           5.7.1 MARKET BASED ON DIFFERENT TECHNOLOGIES
    5.8 POWER DEVICE ANALYZER: CODES AND REGULATIONS 
           TABLE 7 MARKET: CODES AND REGULATIONS
    5.9 INNOVATIONS AND PATENT REGISTRATIONS 
           TABLE 8 MARKET: INNOVATIONS AND PATENT REGISTRATIONS, APRIL 2016–SEPTEMBER 2021
    5.10 CASE STUDY ANALYSIS 
           5.10.1 MAJOR METROPOLITAN TRANSIT SYSTEM USES VITREK POWER DEVICE ANALYZER TO MONITOR HIGH-POWER DC FEEDERS
                    5.10.1.1 Problem statement
                    5.10.1.2 Solution
           5.10.2 PERFORMING POWER QUALITY STUDIES AND TROUBLESHOOTING LOADS
                    5.10.2.1 Problem statement
                    5.10.2.2 Solution
           5.10.3 HIGH-PRECISION POWER DEVICE ANALYZER FOR ENGINE TEST BENCHES
                    5.10.3.1 Problem statement
                    5.10.3.2 Solution
    5.11 PORTER’S FIVE FORCES ANALYSIS 
                    TABLE 9 MARKET: PORTER’S FIVE FORCES ANALYSIS
                    FIGURE 27 PORTER’S FIVE FORCES ANALYSIS FOR MARKET
           5.11.1 THREAT OF SUBSTITUTES
           5.11.2 BARGAINING POWER OF SUPPLIERS
           5.11.3 BARGAINING POWER OF BUYERS
           5.11.4 THREAT OF NEW ENTRANTS
           5.11.5 INTENSITY OF COMPETITIVE RIVALRY
 
6 POWER DEVICE ANALYZER MARKET, BY TYPE (Page No. - 62)
    6.1 INTRODUCTION 
           FIGURE 28 MARKET, BY TYPE, 2021 (%)
           TABLE 10 MARKET, BY TYPE, 2019–2027 (USD MILLION)
    6.2 BOTH AC AND DC 
           6.2.1 USE OF AC AND DC POWER DEVICE ANALYZERS IN VARIOUS END-USER INDUSTRIES
                    TABLE 11 BOTH AC AND DC: MARKET, BY REGION, 2019–2027 (USD MILLION)
    6.3 AC 
           6.3.1 MANDATORY REGULATIONS FOR ENERGY AUDITS IN EUROPEAN COUNTRIES
                    TABLE 12 AC: MARKET, BY REGION, 2019–2027 (USD MILLION)
    6.4 DC 
           6.4.1 INCREASING DEPLOYMENT OF EVS AND GROWING RENEWABLE ENERGY SECTOR
                    TABLE 13 DC: MARKET, BY REGION, 2019–2027 (USD MILLION)
 
7 POWER DEVICE ANALYZER MARKET, BY CURRENT (Page No. - 67)
    7.1 INTRODUCTION 
           FIGURE 29 MARKET, BY CURRENT, 2021 (%)
           TABLE 14 MARKET, BY CURRENT, 2019–2027 (USD MILLION)
    7.2 BELOW 1000A 
           7.2.1 RISE IN DEMAND FOR ELECTRIC VEHICLES TO FUEL DEMAND
                    TABLE 15 BELOW 1000A: MARKET, BY REGION, 2019–2027 (USD MILLION)
    7.3 ABOVE 1000A 
           7.3.1 GROWTH IN CONSUMER ELECTRONICS INDUSTRY TO DRIVE MARKET
                    TABLE 16 ABOVE 1000A: MARKET, BY REGION, 2019–2027 (USD MILLION)
 
8 POWER DEVICE ANALYZER MARKET, BY END USER (Page No. - 71)
    8.1 INTRODUCTION 
           FIGURE 30 MARKET, BY END USER, 2021 (%)
           TABLE 17 MARKET, BY END USER, 2019–2027 (USD MILLION)
    8.2 CONSUMER ELECTRONICS AND APPLIANCES 
           8.2.1 GROWING DEMAND FOR CONSUMER ELECTRONIC PRODUCTS IN ASIA PACIFIC
                    TABLE 18 CONSUMER ELECTRONICS AND APPLIANCES: MARKET, BY REGION, 2019–2027 (USD MILLION)
    8.3 AUTOMOTIVE 
           8.3.1 RISING ADOPTION OF ELECTRIC VEHICLES AND INCREASING INVESTMENTS IN AUTONOMOUS VEHICLES
                    TABLE 19 AUTOMOTIVE: MARKET, BY REGION, 2019–2027 (USD MILLION)
    8.4 TELECOMMUNICATION 
           8.4.1 INCREASE IN NUMBER OF DATA CENTERS AND GROWTH OF TELECOM SECTOR
                    TABLE 20 TELECOMMUNICATION: MARKET, BY REGION, 2019–2027 (USD MILLION)
    8.5 ENERGY 
           8.5.1 RISE IN GLOBAL POWER CONSUMPTION
                    TABLE 21 ENERGY: MARKET, BY REGION, 2019–2027 (USD MILLION)
    8.6 MEDICAL 
           8.6.1 INCREASING INVESTMENTS FOR ELECTRICAL EQUIPMENT IN HEALTHCARE SECTOR
                    TABLE 22 MEDICAL: MARKET, BY REGION, 2019–2027 (USD MILLION)
    8.7 OTHERS 
           8.7.1 STRONG DEMAND FROM AEROSPACE AND DEFENSE SECTOR
                    TABLE 23 OTHERS: MARKET, BY REGION, 2019–2027 (USD MILLION)
 
9 POWER DEVICE ANALYZER MARKET, BY REGION (Page No. - 79)
    9.1 INTRODUCTION 
           FIGURE 31 REGIONAL SNAPSHOT: MARKET IN ASIA PACIFIC, SOUTH AMERICA, AND NORTH AMERICA TO GROW AT HIGHEST CAGR DURING FORECAST PERIOD
           FIGURE 32 MARKET, IN TERMS OF VALUE, BY REGION, 2021
           TABLE 24 MARKET, BY REGION, 2019–2027 (USD MILLION)
           TABLE 25 MARKET, BY VOLUME, 2019–2027 (MILLION UNITS)
    9.2 ASIA PACIFIC 
           FIGURE 33 ASIA PACIFIC: REGIONAL SNAPSHOT
           9.2.1 ASIA PACIFIC: RECESSION IMPACT
           9.2.2 BY TYPE
                    TABLE 26 ASIA PACIFIC: MARKET, BY TYPE, 2019–2027 (USD MILLION)
           9.2.3 BY CURRENT
                    TABLE 27 ASIA PACIFIC: MARKET, BY CURRENT, 2019–2027 (USD MILLION)
           9.2.4 BY END USER
                    TABLE 28 ASIA PACIFIC: MARKET, BY END USER, 2019–2027 (USD MILLION)
           9.2.5 BY COUNTRY
                    TABLE 29 ASIA PACIFIC: MARKET, BY COUNTRY 2019–2027 (USD MILLION)
                    9.2.5.1 China
                               9.2.5.1.1 Growing automotive and consumer electronics industry
                               TABLE 30 CHINA: MARKET, BY TYPE, 2019–2027 (USD MILLION)
                               TABLE 31 CHINA: MARKET, BY CURRENT, 2019–2027 (USD MILLION)
                               TABLE 32 CHINA: MARKET, BY END USER, 2019–2027 (USD MILLION)
                    9.2.5.2 Japan
                               9.2.5.2.1 Rapid industrialization and growth of automotive sector
                               TABLE 33 JAPAN: MARKET, BY TYPE, 2019–2027 (USD MILLION)
                               TABLE 34 JAPAN: MARKET, BY CURRENT, 2019–2027 (USD MILLION)
                               TABLE 35 JAPAN: MARKET, BY END USER, 2019–2027 (USD MILLION)
                    9.2.5.3 Australia
                               9.2.5.3.1 Increasing demand for electric vehicles
                               TABLE 36 AUSTRALIA: MARKET, BY TYPE, 2019–2027 (USD MILLION)
                               TABLE 37 AUSTRALIA: MARKET, BY CURRENT, 2019–2027 (USD MILLION)
                               TABLE 38 AUSTRALIA: MARKET, BY END USER, 2019–2027 (USD MILLION)
                    9.2.5.4 South Korea
                               9.2.5.4.1 Growth of electronics industry
                               TABLE 39 SOUTH KOREA: MARKET, BY TYPE, 2019–2027 (USD MILLION)
                               TABLE 40 SOUTH KOREA: MARKET, BY CURRENT, 2019–2027 (USD MILLION)
                               TABLE 41 SOUTH KOREA: MARKET, BY END USER, 2019–2027 (USD MILLION)
                    9.2.5.5 India
                               9.2.5.5.1 Government support for adoption of EVs
                               TABLE 42 INDIA: MARKET, BY TYPE, 2019–2027 (USD MILLION)
                               TABLE 43 INDIA: MARKET, BY CURRENT, 2019–2027 (USD MILLION)
                               TABLE 44 INDIA: MARKET, BY END USER, 2019–2027 (USD MILLION)
                    9.2.5.6 Rest of Asia Pacific
                               9.2.5.6.1 Increasing investments in telecommunication technologies
                               TABLE 45 REST OF ASIA PACIFIC: MARKET, BY TYPE, 2019–2027 (USD MILLION)
                               TABLE 46 REST OF ASIA PACIFIC: MARKET, BY CURRENT, 2019–2027 (USD MILLION)
                               TABLE 47 REST OF ASIA PACIFIC: MARKET, BY END USER, 2019–2027 (USD MILLION)
    9.3 NORTH AMERICA 
           FIGURE 34 NORTH AMERICA: REGIONAL SNAPSHOT
           9.3.1 NORTH AMERICA: RECESSION IMPACT
           9.3.2 BY TYPE
                    TABLE 48 NORTH AMERICA: MARKET, BY TYPE, 2019–2027 (USD MILLION)
           9.3.3 BY CURRENT
                    TABLE 49 NORTH AMERICA: MARKET, BY CURRENT, 2019–2027 (USD MILLION)
           9.3.4 BY END USER
                    TABLE 50 NORTH AMERICA: MARKET, BY END USER, 2019–2027 (USD MILLION)
           9.3.5 BY COUNTRY
                    TABLE 51 NORTH AMERICA: MARKET, BY COUNTRY, 2019–2027 (USD MILLION)
                    9.3.5.1 US
                               9.3.5.1.1 Increasing 5G network testing and growth of aerospace and defense sector
                               TABLE 52 US: MARKET, BY TYPE, 2019–2027 (USD MILLION)
                               TABLE 53 US: MARKET, BY CURRENT, 2019–2027 (USD MILLION)
                               TABLE 54 US: MARKET, BY END USER, 2019–2027 (USD MILLION)
                    9.3.5.2 Canada
                               9.3.5.2.1 Government policies to boost EV market to bring revenue
                               TABLE 55 CANADA: MARKET, BY TYPE, 2019–2027 (USD MILLION)
                               TABLE 56 CANADA: MARKET, BY CURRENT, 2019–2027 (USD MILLION)
                               TABLE 57 CANADA: MARKET, BY END USER, 2019–2027 (USD MILLION)
                    9.3.5.3 Mexico
                               9.3.5.3.1 Growth of consumer electronics and automotive industry along with high industrialization
                               TABLE 58 MEXICO: MARKET, BY TYPE, 2019–2027 (USD MILLION)
                               TABLE 59 MEXICO: MARKET, BY CURRENT, 2019–2027 (USD MILLION)
                               TABLE 60 MEXICO: MARKET, BY END USER, 2019–2027 (USD MILLION)
    9.4 EUROPE 
           FIGURE 35 EUROPE: REGIONAL SNAPSHOT
           9.4.1 EUROPE: RECESSION IMPACT
           9.4.2 BY TYPE
                    TABLE 61 EUROPE: MARKET, BY TYPE, 2019–2027 (USD MILLION)
           9.4.3 BY CURRENT
                    TABLE 62 EUROPE: MARKET, BY CURRENT, 2019–2027 (USD MILLION)
           9.4.4 BY END USER
                    TABLE 63 EUROPE: MARKET, BY END USER, 2019–2027 (USD MILLION)
           9.4.5 BY COUNTRY
                    TABLE 64 EUROPE: MARKET, BY COUNTRY, 2019–2027 (USD MILLION)
                    9.4.5.1 UK
                               9.4.5.1.1 Increasing 5G network testing
                               TABLE 65 UK: MARKET, BY TYPE, 2019–2027 (USD MILLION)
                               TABLE 66 UK: MARKET, BY CURRENT, 2019–2027 (USD MILLION)
                               TABLE 67 UK: MARKET, BY END USER, 2019–2027 (USD MILLION)
                    9.4.5.2 Germany
                               9.4.5.2.1 Growing emphasis on renewable energy generation and developing EV market
                               TABLE 68 GERMANY: MARKET, BY TYPE, 2019–2027 (USD MILLION)
                               TABLE 69 GERMANY: MARKET, BY CURRENT, 2019–2027 (USD MILLION)
                               TABLE 70 GERMANY: MARKET, BY END USER, 2019–2027 (USD MILLION)
                    9.4.5.3 France
                               9.4.5.3.1 Robust demand from aerospace industry along with high industrialization
                               TABLE 71 FRANCE: MARKET, BY TYPE, 2019–2027 (USD MILLION)
                               TABLE 72 FRANCE: MARKET, BY CURRENT, 2019–2027 (USD MILLION)
                               TABLE 73 FRANCE: MARKET, BY END USER, 2019–2027 (USD MILLION)
                    9.4.5.4 Russia
                               9.4.5.4.1 Government policies to boost EV industry
                               TABLE 74 RUSSIA: MARKET, BY TYPE, 2019–2027 (USD MILLION)
                               TABLE 75 RUSSIA: MARKET, BY CURRENT, 2019–2027 (USD MILLION)
                               TABLE 76 RUSSIA: MARKET, BY END USER, 2019–2027 (USD MILLION)
                    9.4.5.5 Spain
                               9.4.5.5.1 Growing need for energy efficiency
                               TABLE 77 SPAIN: MARKET, BY TYPE, 2019–2027 (USD MILLION)
                               TABLE 78 SPAIN: MARKET, BY CURRENT, 2019–2027 (USD MILLION)
                               TABLE 79 SPAIN: MARKET, BY END USER, 2019–2027 (USD MILLION)
                    9.4.5.6 Italy
                               9.4.5.6.1 Focus on renewable energy and upgrades in power transmission sector
                               TABLE 80 ITALY: MARKET, BY TYPE, 2019–2027 (USD MILLION)
                               TABLE 81 ITALY: MARKET, BY CURRENT, 2019–2027 (USD MILLION)
                               TABLE 82 ITALY: MARKET, BY END USER, 2019–2027 (USD MILLION)
                    9.4.5.7 Rest of Europe
                               9.4.5.7.1 Growth in manufacturing sector
                               TABLE 83 REST OF EUROPE: MARKET, BY TYPE, 2019–2027 (USD MILLION)
                               TABLE 84 REST OF EUROPE: MARKET, BY CURRENT, 2019–2027 (USD MILLION)
                               TABLE 85 REST OF EUROPE: MARKET, BY END USER, 2019–2027 (USD MILLION)
    9.5 SOUTH AMERICA 
           9.5.1 SOUTH AMERICA: RECESSION IMPACT
           9.5.2 BY TYPE
                    TABLE 86 SOUTH AMERICA: MARKET, BY TYPE, 2019–2027 (USD MILLION)
           9.5.3 BY CURRENT
                    TABLE 87 SOUTH AMERICA: MARKET, BY CURRENT, 2019–2027 (USD MILLION)
           9.5.4 BY END USER
                    TABLE 88 SOUTH AMERICA: MARKET, BY END USER, 2019–2027 (USD MILLION)
           9.5.5 BY COUNTRY
                    TABLE 89 SOUTH AMERICA: MARKET, BY COUNTRY 2019–2027 (USD MILLION)
                    9.5.5.1 Brazil
                               9.5.5.1.1 Increasing adoption of renewable energy
                               TABLE 90 BRAZIL: MARKET, BY TYPE, 2019–2027 (USD MILLION)
                               TABLE 91 BRAZIL: MARKET, BY CURRENT, 2019–2027 (USD MILLION)
                               TABLE 92 BRAZIL: MARKET, BY END USER, 2019–2027 (USD MILLION)
                    9.5.5.2 Argentina
                               9.5.5.2.1 Increasing investments in automotive sector
                               TABLE 93 ARGENTINA: MARKET, BY TYPE, 2019–2027 (USD MILLION)
                               TABLE 94 ARGENTINA: MARKET, BY CURRENT, 2019–2027 (USD MILLION)
                               TABLE 95 ARGENTINA: MARKET, BY END USER, 2019–2027 (USD MILLION)
                    9.5.5.3 Chile
                               9.5.5.3.1 Growing manufacturing sector
                               TABLE 96 CHILE: MARKET, BY TYPE, 2019–2027 (USD MILLION)
                               TABLE 97 CHILE: MARKET, BY CURRENT, 2019–2027 (USD MILLION)
                               TABLE 98 CHILE: MARKET, BY END USER, 2019–2027 (USD MILLION)
                    9.5.5.4 Rest of South America
                               9.5.5.4.1 Increasing investments in renewable energy
                               TABLE 99 REST OF SOUTH AMERICA: MARKET, BY TYPE, 2019–2027 (USD MILLION)
                               TABLE 100 REST OF SOUTH AMERICA: MARKET, BY CURRENT, 2019–2027 (USD MILLION)
                               TABLE 101 REST OF SOUTH AMERICA: MARKET, BY END USER, 2019–2027 (USD MILLION)
    9.6 MIDDLE EAST & AFRICA 
           9.6.1 MIDDLE EAST & AFRICA: RECESSION IMPACT
           9.6.2 BY TYPE
                    TABLE 102 MIDDLE EAST & AFRICA: MARKET, BY TYPE, 2019–2027 (USD MILLION)
           9.6.3 BY CURRENT
                    TABLE 103 MIDDLE EAST & AFRICA: MARKET, BY CURRENT, 2019–2027 (USD MILLION)
           9.6.4 BY END USER
                    TABLE 104 MIDDLE EAST & AFRICA: MARKET, BY END USER, 2019–2027 (USD MILLION)
           9.6.5 BY COUNTRY
                    TABLE 105 MIDDLE EAST & AFRICA: MARKET, BY COUNTRY, 2019–2027 (USD MILLION)
                    9.6.5.1 Saudi Arabia
                               9.6.5.1.1 Growing telecommunication sector and consumer electronics market
                               TABLE 106 SAUDI ARABIA: MARKET, BY TYPE, 2019–2027 (USD MILLION)
                               TABLE 107 SAUDI ARABIA: MARKET, BY CURRENT, 2019–2027 (USD MILLION)
                               TABLE 108 SAUDI ARABIA: MARKET, BY END USER, 2019–2027 (USD MILLION)
                    9.6.5.2 UAE
                               9.6.5.2.1 Increasing focus on renewable energy
                               TABLE 109 UAE: MARKET, BY TYPE, 2019–2027 (USD MILLION)
                               TABLE 110 UAE: MARKET, BY CURRENT, 2019–2027 (USD MILLION)
                               TABLE 111 UAE: MARKET, BY END USER, 2019–2027 (USD MILLION)
                    9.6.5.3 South Africa
                               9.6.5.3.1 Increasing investments in power and renewable energy sectors
                               TABLE 112 SOUTH AFRICA: MARKET, BY TYPE, 2019–2027 (USD MILLION)
                               TABLE 113 SOUTH AFRICA: MARKET, BY CURRENT, 2019–2027 (USD MILLION)
                               TABLE 114 SOUTH AFRICA: MARKET, BY END USER, 2019–2027 (USD MILLION)
                    9.6.5.4 Rest of Middle East & Africa
                               9.6.5.4.1 Growth of manufacturing sector to boost power device analyzer market
                               TABLE 115 REST OF MIDDLE EAST & AFRICA: MARKET, BY TYPE, 2019–2027 (USD MILLION)
                               TABLE 116 REST OF MIDDLE EAST & AFRICA: MARKET, BY CURRENT, 2019–2027 (USD MILLION)
                               TABLE 117 REST OF MIDDLE EAST & AFRICA: MARKET, BY END USER, 2019–2027 (USD MILLION)
 
10 COMPETITIVE LANDSCAPE (Page No. - 132)
     10.1 STRATEGIES ADOPTED BY KEY PLAYERS/RIGHT TO WIN 
               TABLE 118 OVERVIEW OF STRATEGIES ADOPTED BY TOP PLAYERS, JANUARY 2017–APRIL 2021
     10.2 MARKET SHARE ANALYSIS 
               TABLE 119 POWER DEVICE ANALYZER MARKET: DEGREE OF COMPETITION
               FIGURE 36 LEADING PLAYERS IN MARKET
     10.3 MARKET EVALUATION FRAMEWORK 
               TABLE 120 MARKET EVALUATION FRAMEWORK
     10.4 REVENUE ANALYSIS OF TOP FIVE MARKET PLAYERS 
               FIGURE 37 TOP FIVE PLAYERS IN MARKET FROM 2017 TO 2021
     10.5 COMPETITIVE SCENARIO 
               TABLE 121 MARKET: PRODUCT LAUNCHES, JANUARY 2017– DECEMBER 2022
               TABLE 122 MARKET: DEALS, JUNE 2017–DECEMBER 2022
               TABLE 123 MARKET: OTHERS, JULY 2017–DECEMBER 2022
     10.6 COMPANY EVALUATION QUADRANT 
             10.6.1 STARS
             10.6.2 EMERGING LEADERS
             10.6.3 PERVASIVE PLAYERS
             10.6.4 PARTICIPANTS
                       FIGURE 38 COMPANY EVALUATION QUADRANT: MARKET, 2021
             10.6.5 COMPETITIVE BENCHMARKING
                       TABLE 124 COMPANY PRODUCT FOOTPRINT
                       TABLE 125 COMPANY END USER FOOTPRINT
                       TABLE 126 COMPANY CURRENT FOOTPRINT
                       TABLE 127 COMPANY REGION FOOTPRINT
 
11 COMPANY PROFILES (Page No. - 145)
(Business overview, Products/Solutions/Services offered, Recent developments & MnM View)*
     11.1 KEY PLAYERS 
             11.1.1 KEYSIGHT TECHNOLOGIES
                       TABLE 128 KEYSIGHT TECHNOLOGIES: COMPANY OVERVIEW
                       FIGURE 39 KEYSIGHT TECHNOLOGIES: COMPANY SNAPSHOT
                       TABLE 129 KEYSIGHT TECHNOLOGIES: PRODUCTS/SOLUTIONS/SERVICES OFFERED
                       TABLE 130 KEYSIGHT TECHNOLOGIES: PRODUCT LAUNCHES
             11.1.2 YOKOGAWA ELECTRIC CORPORATION
                       TABLE 131 YOKOGAWA ELECTRIC CORPORATION: COMPANY OVERVIEW
                       FIGURE 40 YOKOGAWA ELECTRIC CORPORATION: COMPANY SNAPSHOT
                       TABLE 132 YOKOGAWA ELECTRIC CORPORATION: PRODUCTS/SOLUTIONS/SERVICES OFFERED
                       TABLE 133 YOKOGAWA ELECTRIC CORPORATION: PRODUCT LAUNCHES
                       TABLE 134 YOKOGAWA ELECTRIC CORPORATION: OTHERS
             11.1.3 FLUKE CORPORATION
                       TABLE 135 FLUKE CORPORATION: COMPANY OVERVIEW
                       TABLE 136 FLUKE CORPORATION: PRODUCTS/SOLUTIONS/SERVICES OFFERED
                       TABLE 137 FLUKE CORPORATION: PRODUCT LAUNCHES
                       TABLE 138 FLUKE CORPORATION: DEALS
             11.1.4 IWATSU ELECTRIC
                       TABLE 139 IWATSU ELECTRIC: COMPANY OVERVIEW
                       FIGURE 41 IWATSU ELECTRIC: COMPANY SNAPSHOT
                       TABLE 140 IWATSU ELECTRIC: PRODUCTS/SOLUTIONS/SERVICES OFFERED
                       TABLE 141 IWATSU ELECTRIC: DEALS
                       TABLE 142 IWATSU INSTRUMENTS: OTHERS
             11.1.5 HIOKI E.E. CORPORATION
                       TABLE 143 HIOKI E.E. CORPORATION: COMPANY OVERVIEW
                       TABLE 144 HIOKI E.E. CORPORATION: PRODUCTS/SOLUTIONS/SERVICES OFFERED
                       TABLE 145 HIOKI E.E. CORPORATION: PRODUCT LAUNCHES
             11.1.6 ROHDE & SCHWARZ
                       TABLE 146 ROHDE & SCHWARZ: COMPANY OVERVIEW
                       TABLE 147 ROHDE & SCHWARZ: PRODUCTS/SOLUTIONS/SERVICES OFFERED
                       TABLE 148 ROHDE & SCHWARZ: OTHERS
             11.1.7 CARLO GAVAZZI
                       TABLE 149 CARLO GAVAZZI: COMPANY OVERVIEW
                       FIGURE 42 CARLO GAVAZZI: COMPANY SNAPSHOT
                       TABLE 150 CARLO GAVAZZI: PRODUCTS/SOLUTIONS/SERVICES OFFERED
                       TABLE 151 CARLO GAVAZZI: PRODUCT LAUNCHES
             11.1.8 NEWTONS4TH
                       TABLE 152 NEWTONS4TH: COMPANY OVERVIEW
                       TABLE 153 NEWTONS4TH: PRODUCTS/SOLUTIONS/SERVICES OFFERED
             11.1.9 VITREK
                       TABLE 154 VITREK: COMPANY OVERVIEW
                       TABLE 155 VITREK: PRODUCTS/SOLUTIONS/SERVICES OFFERED
                       TABLE 156 VITREK: PRODUCT LAUNCHES
                       TABLE 157 VITREK: DEALS
             11.1.10 CIRCUTOR
                       TABLE 158 CIRCUTOR: COMPANY OVERVIEW
                       TABLE 159 CIRCUTOR: PRODUCTS/SOLUTIONS/SERVICES OFFERED
                       TABLE 160 CIRCUTOR: PRODUCT LAUNCHES
             11.1.11 ZES ZIMMER ELECTRONIC SYSTEMS GMBH
                       TABLE 161 ZES ZIMMER ELECTRONIC SYSTEMS GMBH: COMPANY OVERVIEW
                       TABLE 162 ZES ZIMMER ELECTRONIC SYSTEMS: PRODUCTS/SOLUTIONS/SERVICES OFFERED
                       TABLE 163 ZES ZIMMER ELECTRONIC SYSTEMS: PRODUCT LAUNCHES
             11.1.12 TEXAS INSTRUMENTS
                       TABLE 164 TEXAS INSTRUMENTS: COMPANY OVERVIEW
                       FIGURE 43 TEXAS INSTRUMENTS: COMPANY SNAPSHOT
                       TABLE 165 TEXAS INSTRUMENTS: PRODUCTS/SOLUTIONS/SERVICES OFFERED
                       TABLE 166 TEXAS INSTRUMENTS: DEALS
             11.1.13 PCE INSTRUMENTS
                       TABLE 167 PCE INSTRUMENTS: COMPANY OVERVIEW
                       TABLE 168 PCE INSTRUMENTS: PRODUCTS/SOLUTIONS/SERVICES OFFERED
             11.1.14 EXTECH INSTRUMENTS
                       TABLE 169 EXTECH INSTRUMENTS: COMPANY OVERVIEW
                       TABLE 170 EXTECH INSTRUMENTS: PRODUCTS/SOLUTIONS/SERVICES OFFERED
             11.1.15 DEWETRON
                       TABLE 171 DEWETRON: COMPANY OVERVIEW
                       TABLE 172 DEWETRON: PRODUCTS/SOLUTIONS/SERVICES OFFERED
                       TABLE 173 DEWETRON: DEALS
*Details on Business overview, Products/Solutions/Services offered, Recent developments & MnM View might not be captured in case of unlisted companies.
     11.2 OTHER KEY PLAYERS 
             11.2.1 MAGTROL
             11.2.2 DEWESOFT D.O.O
             11.2.3 JANITZA ELECTRONICS GMBH
             11.2.4 ARBITER SYSTEMS
             11.2.5 VALHALLA SCIENTIFIC
 
12 APPENDIX (Page No. - 186)
     12.1 INSIGHTS FROM INDUSTRY EXPERTS 
     12.2 DISCUSSION GUIDE 
     12.3 KNOWLEDGESTORE: MARKETSANDMARKETS’ SUBSCRIPTION PORTAL 
     12.4 CUSTOMIZATION OPTIONS 
     12.5 RELATED REPORTS 
     12.6 AUTHOR DETAILS 
 

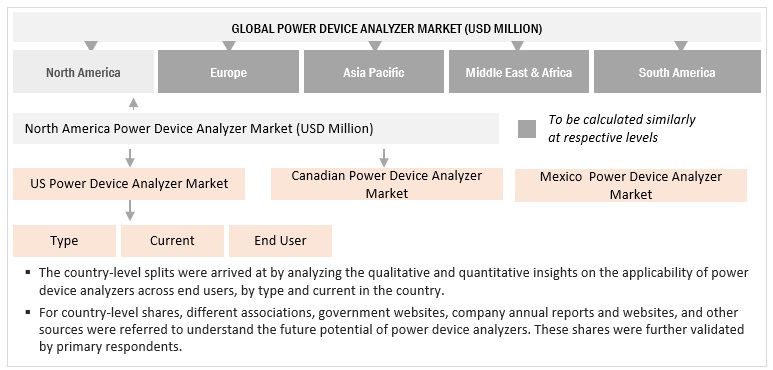
This study involved major activities in estimating the current size of the power device analyzer market. Exhaustive secondary research was done to collect information on the market, peer market, and parent market. The next step was to validate these findings, assumptions, and market sizing with industry experts across the value chain through primary research. Country-wise analysis were used to estimate the total market size. After that, the market breakdown and data triangulation were done to estimate the market size of the segments and sub-segments.

Secondary Research

This research study involved the use of extensive secondary sources, directories, and databases, such as Hoover’s, Bloomberg BusinessWeek, Factiva, and OneSource, to identify and collect information useful for a technical, market-oriented, and commercial study of the global power analyzer market. The other secondary sources included press releases & investor presentations of companies, white papers, certified publications, articles by recognized authors, manufacturer associations, trade directories, and databases.

Primary Research

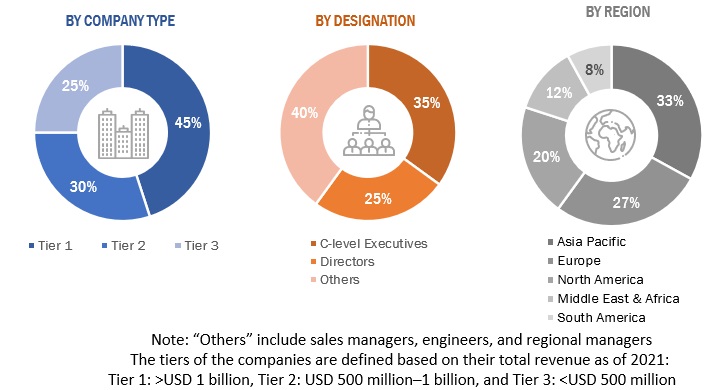
The power device analyzer market comprises several stakeholders, such as product manufacturers, service providers, distributors, and end-users in the supply chain. The demand-side of this market is characterized by its various end-user industries. Moreover, the demand is also driven by the rising demand of increasing energy saving and improving efficiency across every industry. The supply side is characterized by rising demand for contracts from the end user industries, and new product launches. Various primary sources from both the supply and demand sides of the market were interviewed to obtain qualitative and quantitative information. The breakdown of primary respondents is given below:
Power Device Analyzer Market Size, and Share

To know about the assumptions considered for the study, download the pdf brochure

Market Size Estimation
Power Device Analyzer Market Size, and Share

To know about the assumptions considered for the study, Request for Free Sample Report

Data Triangulation

After arriving at the overall market size using the market size estimation processes as explained above—the market was split into several segments and subsegments. To complete the overall market engineering process and arrive at the exact statistics of each market segment and subsegment, data triangulation, and market breakdown procedures were employed, wherever applicable. The data was triangulated by studying various factors and trends from both the demand and supply sides in the power device analyzer market ecosystem.

Report Objectives

  • To define, describe, and forecast the size of the power device analyzer market by type, current, and end user.
  • To estimate and forecast the global power device analyzer market for various segments with respect to 5 main regions, namely, North America, Europe, South America, Middle East & Africa, and Asia Pacific in terms of value and volume
  • To provide detailed information regarding the drivers, restraints, opportunities, and industry-specific challenges that influence the market growth
  • To provide a detailed overview of the power device analyzer value chain, along with industry trends, use cases, security standards, and Porter’s five forces
  • To strategically analyze micromarkets with respect to individual growth trends, prospects, and contribution to the total market
  • To analyze the opportunities in the market for stakeholders by identifying high-growth segments and detail the competitive landscape for market players
  • To strategically profile key players and comprehensively analyze their market rankings and core competencies
  • To analyze competitive developments, such as joint ventures, mergers and acquisitions, contracts, and agreements, and new product launches, in the power device analyzer market
  • To benchmark players within the market using the proprietary competitive leadership mapping framework, which analyzes market players on various parameters within the broad categories of business strategy excellence and strength of product portfolio
  • This report covers the power device analyzer market size in terms of value and volume.

Available Customization

With the given market data, MarketsandMarkets offers customizations according to the specific requirements of companies. The following customization options are available for the report:

Product Analysis

  • Product matrix, which provides a detailed comparison of the product portfolio of each company

Company Information

  • Detailed analyses and profiling of additional market players
Custom Market Research Services

We will customize the research for you, in case the report listed above does not meet with your exact requirements. Our custom research will comprehensively cover the business information you require to help you arrive at strategic and profitable business decisions.

Request Customization

Instant Answers with GPT - Ask Now!

Ask real questions. Get complete answers !
Report Code
EP 7521
Published ON
Jan, 2023
Choose License Type
BUY NOW
  • SHARE
X
Request Customization
Speak to Analyst
Speak to Analyst
OR FACE-TO-FACE MEETING
PERSONALIZE THIS RESEARCH
  • Triangulate with your Own Data
  • Get Data as per your Format and Definition
  • Gain a Deeper Dive on a Specific Application, Geography, Customer or Competitor
  • Any level of Personalization
REQUEST A FREE CUSTOMIZATION
LET US HELP YOU!
  • What are the Known and Unknown Adjacencies Impacting the Power Device Analyzer Market
  • What will your New Revenue Sources be?
  • Who will be your Top Customer; what will make them switch?
  • Defend your Market Share or Win Competitors
  • Get a Scorecard for Target Partners
CUSTOMIZED WORKSHOP REQUEST
+1-888-600-6441
  • Call Us
  • +1-888-600-6441 (Corporate office hours)
  • +1-888-600-6441 (US/Can toll free)
  • +44-800-368-9399 (UK office hours)
CONNECT WITH US
ABOUT TRUST ONLINE
©2024 MarketsandMarkets Research Private Ltd. All rights reserved
DMCA.com Protection Status Website Feedback