Blockchain in Energy Market by Type (Private, Public), Component (Platform, Services), End-user (Power, Oil & Gas), Application (Energy Trading, Grid Management, Payment Schemes, Supply Chain Management), and Region - Global Forecast to 2023


[142 Pages Report] The global blockchain in energy market was valued at USD 279.0 million in 2017 and is projected to reach USD 7,110.1 million by 2023, at a CAGR of 78.32%, during the forecast period.
The years considered for the study are as follows:
- Base Year: 2017
- Estimated Year: 2018
- Projected Year: 2023
- Forecast Period: 2018 � 2023
The base year considered for company profiles is 2017. Whenever information was unavailable for the base year, the prior year has been considered.
Objectives of the Study
- To define and segment the market with respect to type, component, application, end-user, and region
- To provide detailed information about major factors influencing the growth of the blockchain in energy (drivers, restraints, opportunities, and industry-specific challenges)
- To strategically analyze the blockchain energy market with respect to individual growth trends, future expansions, and contributions to the market
- To analyze market opportunities for stakeholders and details of a competitive landscape for market leaders
- To forecast the growth of the market with respect to the major regions (Asia Pacific, Europe, North America, and RoW)
- To strategically profile key players and comprehensively analyze their market rankings and core competencies
- To analyze competitive developments such as new product development, mergers & acquisitions, expansions & investments, and contracts & agreements, in the blockchain energy market
Research Methodology
This research study involved the use of extensive secondary sources, directories, journals on power generation technologies, and other related rental markets; newsletters and databases such as Hoover�s, Bloomberg, Businessweek, and Factiva to identify and collect information useful for a technical, market-oriented, and commercial study of the global blockchain energy market. The primary sources include several industry experts from the core and related industries, vendors, preferred suppliers, technology developers, alliances, and organizations related to all the segments of this industry�s value chain. The research methodology has been explained below.
- Study of annual revenues and market developments of major players providing market
- Analysis of the major end-users and applications of market
- Assessment of future trends and growth of market on the basis of investments in key end-user segments such as power and oil & gas
- Study of contracts & developments related to the market by key players across different regions
- Finalization of the overall market sizes by triangulating the supply-side data, which includes product developments, supply chains, and annual revenues of companies manufacturing market across the globe
After arriving at the overall market size, the market was split into several segments and subsegments. The figure given below illustrates the breakdown of primary interviews conducted during the research study on the basis of company type, designation, and region.
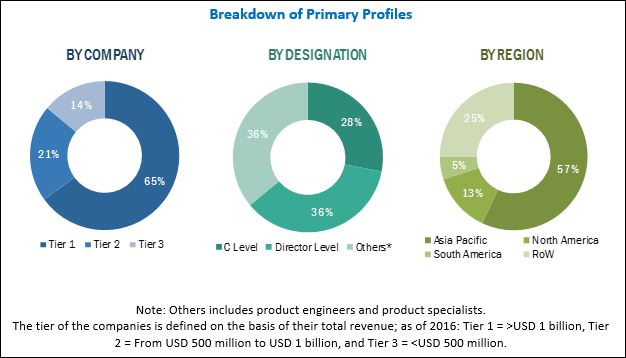
To know about the assumptions considered for the study, download the pdf brochure
Major players operating in the blockchain in energy market include Microsoft (US), Accenture (Ireland), IBM (US), Infosys (India), and SAP (Germany).
Target Audience:
- Blockchain security providers
- Blockchain technology vendors
- Communication service providers
- Consultants/consultancies/advisory firms
- Energy associations
- Government agencies
- Independent software vendors
- Infrastructure and protocol providers
- Managed Service Providers (MSPs)
- Network solution providers
- Payment gateway providers
- Support and maintenance service providers
- System integrators and implementation service providers
- Third-party service providers
- Trading software providers
- Value-Added Resellers (VARs)
Get online access to the report on the World's First Market Intelligence Cloud
- Easy to Download Historical Data & Forecast Numbers
- Company Analysis Dashboard for high growth potential opportunities
- Research Analyst Access for customization & queries
- Competitor Analysis with Interactive dashboard
- Latest News, Updates & Trend analysis
Request Sample Scope of the Report
:
Get online access to the report on the World's First Market Intelligence Cloud
- Easy to Download Historical Data & Forecast Numbers
- Company Analysis Dashboard for high growth potential opportunities
- Research Analyst Access for customization & queries
- Competitor Analysis with Interactive dashboard
- Latest News, Updates & Trend analysis

By Type
- Private
- Public
By Component
- Platform
- Services
By End-User
- Power
- Oil & Gas
By Application
- Grid Management
- Energy Trading
- Government Risk and Compliance Management
- Payment Schemes
- Supply Chain Management
- Others
By Region
- Asia Pacific
- Europe
- North America
- RoW
Available Customizations:
With the given market data, MarketsandMarkets offers customizations as per the client�s specific needs. The following customization options are available for this report:
Company Information
Detailed analyses and profiling of additional market players (up to five)
The global blockchain in energy market is projected to reach a market size of USD 7,110.1 million by 2023, at a CAGR of 78.32%, from an estimated USD 394.3 million in 2018. This growth can be attributed to the Increasing popularity of the blockchain technology in the energy sector, the need to manage infrastructure and other business functions through high transaction speeds and immutability, and the rising security concerns across the globe.
The report segments the blockchains in energy market, by type, into private and public. The private segment is expected to hold the largest market share by 2023, as it is more secure than public blockchain. Also, public blockchain would need larger integrated systems such as blockchain infrastructure and connectivity, whereas private blockchain can be implemented on a smaller scale.
The blockchains in energy market, by component, is segmented into platform and services. The services segment is expected to dominate the market by 2023. Most of the companies are tying up with various blockchain startups to implement blockchain operations such as energy trading, grid management, and supply chain management.
The power segment is one of the major end-users of the blockchain in energy. Also, this segment is expected to hold the largest market share during the forecast period. The blockchain technology in the power sector plays a major role in managing distributed energy resources and provides companies with more cost-effective and efficient solutions to record and process transactional data. In addition, the power sector has the largest number of implemented blockchain in energy projects and R&D investments.
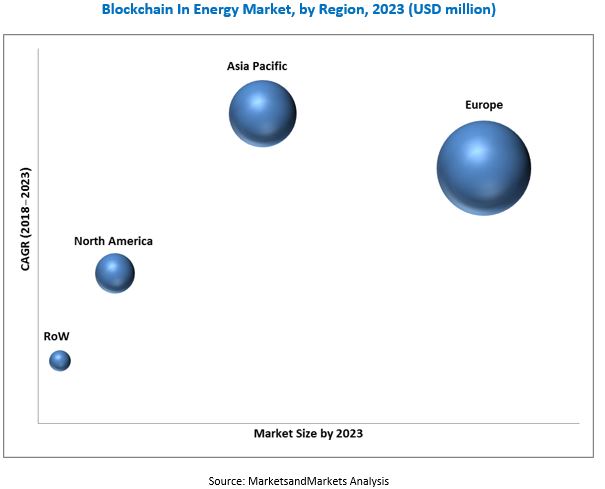
In this report, the blockchain in energy has been analyzed with respect to 4 regions, namely, North America, Europe, the Asia Pacific, Africa, and RoW. The market in Europe is estimated to be the largest market, from 2018 to 2023. Countries such as Germany, the UK, and the Netherlands are heavily investing in adopting blockchain technologies to solve global transaction processes between multiple parties and provide a more secure and accurate data to the customers.
Lack of a common set of regulatory standards, uncertain regulatory landscape, and concerns related to the authenticity of users could act as restraints for the market.
Lack of regulations and uncertainties continue to be some of the biggest restraining factors for the adoption of the blockchain technology in the energy sector, as there is no regulatory standard on how the transactions should be written. Therefore, the US Federal Trade Commission has created a Blockchain Working Group to act toward this and navigate uncharted territory through resource-sharing and hosting experts across the globe.
The leading players in blockchain in energy market are Microsoft (US), Accenture (Ireland), IBM (US), Infosys (India), and SAP (Germany). New product launches are the most commonly adopted strategies by the top players. This was followed by partnerships and investments & expansions.
To speak to our analyst for a discussion on the above findings, click Speak to Analyst
Table of Contents
1 Introduction (Page No. - 15)
1.1 Objectives of the Study
1.2 Definition
1.3 Market Scope
1.3.1 Markets Covered
1.3.2 Years Considered for the Study
1.4 Currency
1.5 Stakeholders
2 Research Methodology (Page No. - 19)
2.1 Introduction
2.2 Research Data
2.2.1 Secondary Data
2.2.2 Primary Data
2.2.2.1 Key Data From Primary Sources
2.2.2.2 Key Industry Insights
2.2.2.3 Breakdown of Primary Interviews
2.3 Market Size Estimation
2.3.1 Bottom-Up Approach
2.3.2 Top Down Approach
2.4 Market Breakdown & Data Triangulation
2.5 Research Limitations
2.6 Research Assumptions
3 Executive Summary (Page No. - 27)
4 Premium Insights (Page No. - 32)
4.1 Attractive Opportunities in the Blockchain in Energy Market During the Forecast Period
4.2 Blockchain in Energy, By Country
4.3 European Blockchain in Energy, By Application & Country
4.4 Blockchain in Energy, By End-User
4.5 Blockchain in Energy, By Component
4.6 Blockchain in Energy, By Type
5 Market Overview (Page No. - 37)
5.1 Introduction
5.2 Market Dynamics
5.3 Drivers
5.3.1 Increasing Popularity of the Blockchain Technology in the Energy Sector
5.3.2 Manages Infrastructure and Other Business Functions Through High Transaction Speed and Immutability
5.3.3 Low Cost of Bandwidth and Computing
5.3.4 Rising Security Concerns Across the Globe
5.4 Restraints
5.4.1 Lack of A Common Set of Regulatory Standards and Uncertain Regulatory Landscape
5.4.2 Concerns Related to the Authenticity of Users
5.5 Opportunities
5.5.1 Increasing Venture Funding and Investments in the Blockchain Technology
5.5.2 Innovation Across International Trade and Supply Chain Management
5.6 Challenges
5.6.1 Lack of Awareness and Technical Understanding About the Blockchain Technology
5.6.2 Opposition From Incumbents
6 Blockchains in Energy Market, By Type (Page No. - 41)
6.1 Introduction
6.2 Private
6.3 Public
7 Blockchains in Energy Market, By Component (Page No. - 45)
7.1 Introduction
7.2 Platform
7.3 Services
8 Blockchains in Energy Market, By End-User (Page No. - 49)
8.1 Introduction
8.2 Power Sector
8.3 Oil & Gas Sector
9 Blockchains in Energy Market, By Application (Page No. - 53)
9.1 Introduction
9.2 Grid Management
9.3 Energy Trading
9.4 Government Risk and Compliance Management
9.5 Payment Schemes
9.6 Supply Chain Management
9.7 Others
10 Blockchain in Energy Market, By Region (Page No. - 59)
10.1 Introduction
10.2 Europe
10.2.1 By Type
10.2.2 By Component
10.2.3 By Application
10.2.4 By End-User
10.2.5 By Country
10.2.5.1 Germany
10.2.5.2 UK
10.2.5.3 Netherlands
10.2.5.4 Rest of Europe
10.3 Asia Pacific
10.3.1 By Type
10.3.2 By Component
10.3.3 By Application
10.3.4 By End-User
10.3.5 By Country
10.3.5.1 Japan
10.3.5.2 Singapore
10.3.5.3 Australia
10.3.5.4 New Zealand
10.3.5.5 Rest of Asia Pacific
10.4 North America
10.4.1 By Type
10.4.2 By Component
10.4.3 By End-User
10.4.4 By Application
10.4.5 By Country
10.4.5.1 US
10.4.5.2 Canada
10.5 Rest of the World
10.5.1 By Type
10.5.2 By Component
10.5.3 By Application
10.5.4 By End-User
10.5.5 By Country
10.5.5.1 Brazil
10.5.5.2 Israel
10.5.5.3 UAE
10.5.5.4 South Africa
10.5.5.5 Rest of Other Countries
11 Competitive Landscape (Page No. - 90)
11.1 Introduction
11.2 Ranking of Players, 2017
11.3 Competitive Scenario
11.3.1 New Product Developments
11.3.2 Investments & Expansions
11.3.3 Mergers & Acquisitions
11.3.4 Contracts & Agreements
12 Company Benchmarking (Page No. - 96)
*Details on Business Overview, Services & Solutions Offered, Recent Developments, MnM View
12.1 Accenture
12.2 AWS
12.3 Bigchaindb
12.4 BTL
12.5 Deloitte
12.6 Grid+
12.7 IBM
12.8 Infosys
12.9 Microsoft
12.10 Nodalblock
12.11 Oracle
12.12 Power Ledger
12.13 SAP
12.14 Wepower
12.15 Lo3 Energy
12.16 Enosi
12.17 Electron
12.18 Drift
(Business Overview, Services & Solutions Offered, Recent Developments, MnM View)
13 Appendix (Page No. - 135)
13.1 Insights of Industry Experts
13.2 Discussion Guide
13.3 Knowledge Store: Marketsandmarkets� Subscription Portal
13.4 Available Customizations
13.5 Related Reports
13.6 Author Details
List of Tables (71 Tables)
Table 1 Blockchain in Energy Market Snapshot
Table 2 Blockchain Energy Market Size, By Type, 2017�2023 (USD Million)
Table 3 Private: Blockchain Energy Market Size, By Region, 2017�2023 (USD Million)
Table 4 Public: Blockchain Energy Market Size, By Region, 2017�2023 (USD Million)
Table 5 Market Size, By Component, 2017�2023 (USD Million)
Table 6 Platform: Market Size, By Region, 2017�2023 (USD Million)
Table 7 Services: Blockchain Energy Market Size, By Region, 2017�2023 (USD Million)
Table 8 Market Size, By End-User, 2017�2023 (USD Million)
Table 9 Power Sector: Blockchain Energy Market Size, By Region, 2017�2023 (USD Million)
Table 10 Oil & Gas Sector: Blockchain Energy Market Size, By Region, 2017-2023 (USD Million)
Table 11 Market Size, By Application, 2017�2023 (USD Million)
Table 12 Grid Management: Blockchain Energy Market Size, By Region, 2017�2023 (USD Million)
Table 13 Energy Trading: Blockchain Energy Market Size, By Region, 2017�2023 (USD Million)
Table 14 Government Risk and Compliance Management: Market Size, By Region, 2017�2023 (USD Million)
Table 15 Payment Schemes: Market Size, By Region, 2017�2023 (USD Million)
Table 16 Supply Chain Management: Market Size, By Region, 2017�2023 (USD Million)
Table 17 Others: Blockchain Energy Market Size, By Region, 2017�2023 (USD Million)
Table 18 Blockchains in Energy Market Size, By Region, 2017�2023 (USD Million)
Table 19 Europe : Blockchain in Energy Size, By Type, 2017�2023 (USD Million)
Table 20 Europe: Market Size, By Component, 2017�2023 (USD Million)
Table 21 Europe: Blockchain Energy Market Size, By Application, 2017�2023 (USD Million)
Table 22 Europe: Blockchain Energy Market Size, By End-User, 2017�2023 (USD Million)
Table 23 Europe: Market Size, By Country, 2017�2023 (USD Million)
Table 24 Germany: Market Size, By Type, 2017�2023 (USD Million)
Table 25 Germany: Blockchain Energy Market Size, By Component, 2017�2023 (USD Million)
Table 26 UK: Market Size, By Type, 2017�2023 (USD Million)
Table 27 UK: Blockchain Energy Market Size, By Component, 2017�2023 (USD Million)
Table 28 Netherlands: Market Size, By Type, 2017�2023 (USD Million)
Table 29 Netherland: Blockchain Energy Market Size, By Component, 2017�2023 (USD Million)
Table 30 Rest of Europe: Market Size, By Type, 2017�2023 (USD Million)
Table 31 Rest of Europe: Market Size, By Component, 2017�2023 (USD Million)
Table 32 Asia Pacific: Market Size, By Type, 2017�2023 (USD Million)
Table 33 Asia Pacific: Market Size, By Component, 2017�2023 (USD Million)
Table 34 Asia Pacific: Blockchain Energy Market Size, By Application, 2017�2023 (USD Million)
Table 35 Asia Pacific: Blockchain Energy Market Size, By End-User, 2017�2023 (USD Million)
Table 36 Asia Pacific: Market Size, By Country, 2017�2023 (USD Million)
Table 37 Japan: Market Size, By Type, 2017�2023 (USD Million)
Table 38 Japan: Blockchain Energy Market Size, By Component, 2017�2023 (USD Million)
Table 39 Singapore: Market Size, By Type, 2017�2023 (USD Million)
Table 40 Singapore: Market Size, By Component, 2017�2023 (USD Million)
Table 41 Australia: Market Size, By Type, 2017�2023 (USD Million)
Table 42 Australia: Blockchain Energy Market Size, By Component, 2017�2023 (USD Million)
Table 43 New Zealand: Market Size, By Type, 2017�2023 (USD Million)
Table 44 New Zealand: Blockchain Energy Market Size, By Component, 2017�2023 (USD Million)
Table 45 Rest of Asia Pacific: Market Size, By Type, 2017�2023 (USD Million)
Table 46 Rest of Asia Pacific: Market Size, By Component, 2017�2023 (USD Million)
Table 47 North America: Market Size, By Type, 2017�2023 (USD Million)
Table 48 North America: Market Size, By Component, 2017�2023 (USD Million)
Table 49 North America: Blockchain Energy Market Size, By End-User, 2017�2023 (USD Million)
Table 50 North America: Blockchain Energy Market Size, By Application, 2017�2023 (USD Million)
Table 51 North America: Market Size, By Country, 2017�2023 (USD Million)
Table 52 US: Market Size, By Type, 2017�2023 (USD Million)
Table 53 US: Blockchain Energy Market Size, By Component, 2017�2023 (USD Million)
Table 54 Canada: Market Size, By Type, 2017�2023 (USD Million)
Table 55 Canada: Blockchain Energy Market Size, By Component, 2017�2023 (USD Million)
Table 56 Rest of the World: Market Size, By Type, 2017�2023 (USD Million)
Table 57 Rest of the World: Market Size, By Component, 2017�2023 (USD Million)
Table 58 Rest of the World: Blockchain Energy Market Size, By Application, 2017�2023 (USD Million)
Table 59 Rest of the World: Blockchain Energy Market Size, By End-User, 2017�2023 (USD Million)
Table 60 Rest of the World: Market Size, By Country, 2017�2023 (USD Million)
Table 61 Brazil: Market Size, By Type, 2017�2023 (USD Million)
Table 62 Brazil: Blockchain Energy Market Size, By Component, 2017�2023 (USD Million)
Table 63 Israel: Market Size, By Type, 2017�2023 (USD Million)
Table 64 Israel: Market Size, By Component, 2017�2023 (USD Million)
Table 65 UAE: Market Size, By Type, 2017�2023 (USD Million)
Table 66 UAE: Blockchain Energy Market Size, By Component, 2017�2023 (USD Million)
Table 67 South Africa: Market Size, By Type, 2017�2023 (USD Million)
Table 68 South Africa: Blockchain Energy Market Size, By Component, 2017�2023 (USD Million)
Table 69 Rest of Other Countries: Blockchain Energy Market Size, By Type, 2017�2023 (USD Million)
Table 70 Rest of Other Countries: Market Size, By Component, 2017�2023 (USD Million)
Table 71 Microsoft: the Most Active Player in the Blockchain Energy Market Between 2015 and July 2018
List of Figures (37 Figures)
Figure 1 Blockchains in Energy Market Segmentation
Figure 2 Research Design
Figure 3 Breakdown of Primary Interviews: By Company Type, Designation, & Region
Figure 4 Market Size Estimation Methodology: Bottom-Up Approach
Figure 5 Market Size Estimation Methodology: Top-Down Approach
Figure 6 Data Triangulation Methodology
Figure 7 Private Segment of the Market, By Type, is Expected to Grow at the Highest CAGR During the Forecast Period
Figure 8 Services Segment is Expected to Lead the Blockchain in Energy Sector Market, By Component, During the Forecast Period
Figure 9 Energy Trading Segment is Expected to Grow at the Highest CAGR During the Forecast Period
Figure 10 Power Sector Segment of the Blockchain Energy Market, By End-User, is Expected to Grow at the Highest CAGR During the Forecast Period
Figure 11 Europe Dominated the Market in Terms of Market Share in 2017
Figure 12 Increasing Popularity of the Blockchain Technology in the Energy Sector is Driving the Blockchain in Energy, From 2018 to 2023
Figure 13 The Market in Australia is Expected to Grow at the Highest CAGR During the Forecast Period
Figure 14 Energy Trading Segment and Germany Dominated the Blockchain Energy Market in Europe, in 2017
Figure 15 Power Sector Segment is Expected to Dominate the Blockchain in Energy, By End-User, During the Forecast Period
Figure 16 Services Segment is Estimated to Dominate the Blockchain Energy Market, By Component, During the Forecast Period
Figure 17 Private Segment is Estimated to Dominate the Market, By Type, During the Forecast Period
Figure 18 Blockchain in Energy: Drivers, Restraints, Opportunities, and Challenges
Figure 19 Private Segment Led the Market, By Type, in 2017
Figure 20 Services Segment Led the Blockchain Energy Market, By Component, in 2017
Figure 21 Power Segment Led the Market, By End-User, in 2017
Figure 22 Energy Trading Segment Led the Blockchain Energy Market, By Application, in 2017
Figure 23 Europe is Expected to Grow at the Highest CAGR During the Forecast Period
Figure 24 Europe Led the Blockchain Energy Market in 2017
Figure 25 Europe: Blockchain Energy Market Snapshot
Figure 26 Asia Pacific: Market Snapshot
Figure 27 North America: Blockchain Energy Market Snapshot
Figure 28 Rest of the World: Market Snapshot
Figure 29 Contracts & Agreements Was the Most Widely Adopted Development Strategy Between 2015 and July 2018
Figure 30 Ranking of Key Players in the Market in 2017
Figure 31 Accenture: Company Snapshot
Figure 32 Deloitte: Company Snapshot
Figure 33 IBM: Company Snapshot
Figure 34 Infosys: Company Snapshot
Figure 35 Microsoft: Company Snapshot
Figure 36 Oracle: Company Snapshot
Figure 37 SAP: Company Snapshot


Growth opportunities and latent adjacency in Blockchain in Energy Market