Underground Utility Mapping Market by Component (Technological Solutions (EMI and GPR), and Services (Professional Services, and Managed Services)), Vertical (Telecommunication, Oil & Gas, Government & Public Safety), Region - Global Forecast to 2024


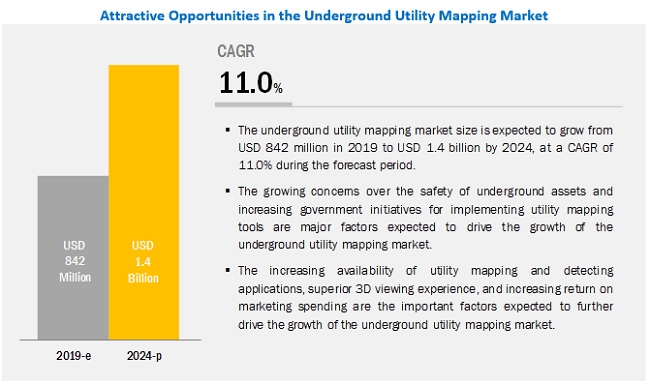
[120 Pages Report] The underground utility mapping market is estimated to be worth USD 842 million in 2019 and is anticipated reaching USD 1.4 billion by 2024, growing at a CAGR of 11.0% between 2019 and 2024. The market is segmented based on component (technological solutions & services), technological solutions (Electromagnetic Induction (EMI), Ground Penetrating Radar (GPR), and others), services (professional [surveying and mapping, training and education, and consulting] and managed services), verticals and region.
By vertical, telecommunication to be a significant contributor to the underground utility mapping market during the forecast period
Telecommunications comprises telephone lines, TV lines, cable TVs, fiber optic cables, and others. Telecommunication lines are the communication facilities that can be made up of paired, insulated copper conductors, such as, TIP (A) and RING (B). The size and number of conductors used in a cable vary with the requirement of the telecommunication system; it can be few or hundreds, or thousands of pairs. Telecommunications and electricity were among the first verticals for which utility mapping tools were adopted in the past. Telecommunications infrastructure has been established worldwide; hence, the market for telecommunications vertical is expected to grow at a below-average rate during the forecast period as it has matured in this segment. However, the emergence of 5G technology is expected to open new opportunities for underground utility mapping and locators in telecommunications vertical in the near future.
Ground penetrating radar (GPR) segment to grow at the highest CAGR during the forecast period
Ground penetrating radar (GPR) is a surveying technique used to locate and map sub-surface features. This technique is used for various applications, such as locating & identifying utilities, buried structures & voids, buried manhole covers, chambers, trench routes, pavement thickness, concrete structures, and rebar placement in existing structures. GPR has an advantage over other locating techniques as it helps in finding both non-metallic and metallic buried utilities. This technique also provides more accurate, faster, and effective results. The GPR system requires an increased level of training and knowledge, and it is also more expensive than other locating equipment.
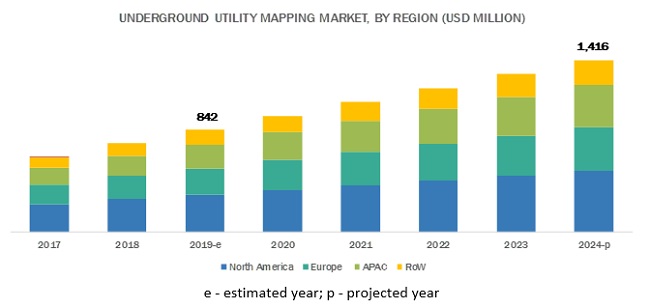
Asia Pacific will grow at the highest CAGR during the forecast period
Across the APAC region, there are several prosperous economies with well-developed utility ecosystems, such as India, China, Australia, Singapore, and Japan. China is the largest market for underground utility mapping in APAC. It has developed its in-house inspection facilities, yet the demand for underground utility mapping applications from the telecommunication and oil & gas verticals is high. With the exploration of shale gas sites in the country, the market for underground utility mapping is expected to further increase during the forecast period. The Chinese government is planning to invest heavily in transportation and railway infrastructure. In 2015, there were almost 14 million gas pipelines laid across Japan.
According to the data given by Hellenic Shipping News in 2017, Japan is the largest liquefied natural gas importer in the world. Japan also ranks fourth in the list of highest coal imports, net imports of petroleum and other liquids, and consumption of crude oil and petroleum products.
Australia and New Zealand are the key countries in this region with developed economies. Australia has witnessed development in the construction industry in recent years. With the increase in smart city infrastructure, there grew a need for mapping underground utility infrastructure for under construction sites, to avoid disruption related to utility damage and delays with construction.
Key Market Players
Major vendors in the underground utility mapping market include Hexagon Geosystems (Sweden), GSSI (US), US Radar (US), Plowman Craven (UK), Cardno (Australia), Sensors & Software (Canada), Vivax-Metrotech (US), and multiVIEW Locates (Canada).
Get online access to the report on the World's First Market Intelligence Cloud
- Easy to Download Historical Data & Forecast Numbers
- Company Analysis Dashboard for high growth potential opportunities
- Research Analyst Access for customization & queries
- Competitor Analysis with Interactive dashboard
- Latest News, Updates & Trend analysis
Request Sample Scope of the Report
:
Get online access to the report on the World's First Market Intelligence Cloud
- Easy to Download Historical Data & Forecast Numbers
- Company Analysis Dashboard for high growth potential opportunities
- Research Analyst Access for customization & queries
- Competitor Analysis with Interactive dashboard
- Latest News, Updates & Trend analysis

|
Report Metrics |
Details |
|
Market size available for years |
2017�2024 |
|
Base year considered |
2018 |
|
Forecast period |
2019�2024 |
|
Forecast units |
Value (USD) |
|
Segments covered |
Component (Technological Solutions & Services), (Technological Solutions [EMI, GPR, and Others]), (Services (professional [surveying and mapping, training and education, and consulting] and managed services), Verticals, and Region |
|
Geographies covered |
North America, Asia Pacific (APAC), Europe, and Rest of the World (RoW) |
|
Companies covered |
Hexagon Geosystems (Sweden), Software & Sensors (Canada), GSSI (US), Cardno (Australia), Guideline Geo (Sweden), US Radar (US), Plowman Craven (UK). A total of 15 players covered. |
This research report categorizes the underground utility mapping market based on Component (Technological Solutions & Services), Technological Solutions (EMI, GPR, and Others), Services (professional [surveying and mapping, training and education, and consulting] and managed services), Verticals and Region.
By Component:
- Technological Solutions
- Electromagnetic Induction (EMI)
- Ground Penetrating Radar (GPR)
- Others (Including magnetic locators, acoustic pipe locator, and vacuum excavator)
- Services
- Professional services
- Surveying & mapping
- Training & education
- Consulting
- Managed services
- Professional services
By Vertical:
- Oil & Gas
- Electricity
- Government & Public Safety
- Construction
- Telecommunication
- Others (Including agriculture & forestry, mining, residential, and logistics)
By Region:
- North America
- Europe
- APAC
- RoW
Recent Developments:
- In May 2019, GSSI partnered with Blinken Tools AB, headquartered in Sweden. This partnership focuses on expanding GSSI�s presence in the Scandinavian region through Blinken�s vast sales and service support expertise in delivering quality products to the construction, industrial, and government sectors.
Key questions addressed by the report:
- Where would all these developments take the industry in the mid to long term?
- What are the upcoming industry solutions for the underground utility mapping market?
- Which are the major factors expected to drive the market?
- Which region would offer high growth for vendors in the market?
- Which solution would gain the largest market share in the market?
Frequently Asked Questions (FAQ):
What is Underground Utility Mapping?
Underground utility mapping is a technique that helps map underground hidden conduits, pipelines, and cables, thereby reducing maintenance costs and the risks associated with utility alignment and leakages. Moreover, the mapping technique helps clients have the precise record of existing and as-built services, minimizes site disruption and potential delays, lessens health and safety risks, and eliminates the risk of utility strikes.What are the types of solutions of Underground Utility Mapping?
Underground utility mapping technology is finding numerous applications in several industries. The underground infrastructure is vital, and construction companies have new opportunities to build and maintain it with the help of technology. The cities and industrial sites comprise streets, buildings, and barriers. The situation below ground is confusing as power, phone, and fiber optic cables share the space with water and gas mains, wastewater, and drains. Technological solutions, such as electromagnetic induction and GPR, help identify and avoid accidents while excavating and drilling the ground.Which are the top industry players in the Underground Utility Mapping market?
Hexagon Geosystems (Sweden), GSSI (US), US Radar (US), Plowman Craven (UK), Cardno (Australia), Sensors & Software (Canada), Vivax-Metrotech (US), and multiVIEW Locates (Canada).What are the top trends in Underground Utility Mapping market?
Trends that are impacting the Underground Utility Mapping market includes:
- Rise in Concerns Over the Safety of Underground Utilities
- Government Initiatives for Implementation of Utility Mapping Tools
Opportunities for the Underground Utility Mapping market:
- High Demand for Real-Time Utility Mapping Applications
- Aging Infrastructure Creating the Need for Maintenance
To speak to our analyst for a discussion on the above findings, click Speak to Analyst
Table of Contents
1 Introduction (Page No. - 15)
1.1 Objectives of the Study
1.2 Market Definition
1.3 Market Scope
1.3.1 Market Segmentation
1.3.2 Regions Covered
1.4 Years Considered for the Study
1.5 Currency Considered
1.6 Stakeholders
2 Research Methodology (Page No. - 18)
2.1 Research Data
2.1.1 Secondary Data
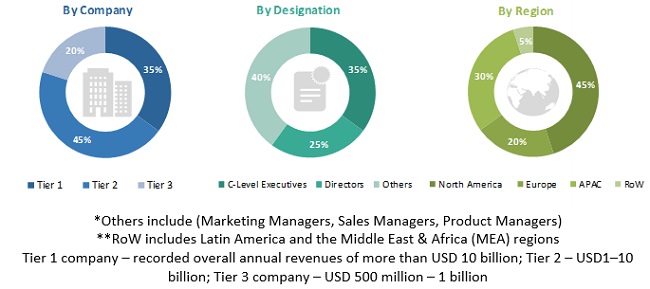
2.1.2 Primary Data
2.1.2.1 Breakup of Primaries
2.1.2.2 Key Industry Insights
2.2 Market Breakup and Data Triangulation
2.3 Market Size Estimation
2.3.1 Top-Down Approach
2.3.2 Bottom-Up Approach
2.4 Market Forecast
2.5 Assumptions for the Study
2.6 Limitations of the Study
3 Executive Summary (Page No. - 26)
4 Premium Insights (Page No. - 29)
4.1 Attractive Opportunities in the Market
4.2 Market in North America, By Organization Size and Country, 2019
4.3 Underground Utility Mapping Market, By Region
4.4 Geographic Market Shares
5 Market Overview (Page No. - 32)
5.1 Introduction
5.2 Market Dynamics
5.2.1 Drivers
5.2.1.1 Rise in Concerns Over the Safety of Underground Utilities
5.2.1.2 Government Initiatives for Implementation of Utility Mapping Tools
5.2.2 Restraints
5.2.2.1 High Ownership and Maintenance Costs of Utility Mapping Tools
5.2.3 Opportunities
5.2.3.1 High Demand for Real-Time Utility Mapping Applications
5.2.3.2 Aging Infrastructure Creating the Need for Maintenance
5.2.4 Challenges
5.2.4.1 Concentrated Demand May Affect Market Growth
5.2.4.2 Lack of Expertise and Skills
5.3 use Cases
5.3.1 Aabsys
5.3.2 Tunisia
5.3.3 Geomodel
5.3.4 Sensors & Software
6 Underground Utility Mapping Market By Component (Page No. - 37)
6.1 Introduction
6.2 Technological Solutions
6.2.1 Need for Real-Time Underground Mapping Expected to Increase the Demand for Technological Solutions
6.3 Services
6.3.1 Rise in Awareness of Utility Mapping Solutions Expected to Increase the Demand for the Utility Mapping Services
7 Underground Utility Mapping Market By Technological Solution (Page No. - 41)
7.1 Introduction
7.2 Electromagnetic Induction
7.2.1 Electromagnetic Induction Helps Map Underground Electromagnetic Field
7.3 Ground Penetrating Radar
7.3.1 Gpr Provides Accurate, Faster, and Effective Results as Compared to Other Techniques
7.4 Others
8 Underground Utility Mapping Market By Service (Page No. - 46)
8.1 Introduction
8.2 Professional Services
8.2.1 Surveying and Mapping
8.2.1.1 Surveying and Mapping Services Reduce Project Planning Time and Minimize Risk in Utility Mapping
8.2.2 Training and Education
8.2.2.1 Growing Need Among Enterprises for Eliminating Knowledge Gaps to Boost the Growth of Training and Education Services
8.2.3 Consulting
8.2.3.1 Consulting Services Help Assess, Design, Deploy, and Optimize Underground Utility Mapping Solutions
8.3 Managed Services
8.3.1 Managed Services Offer a Complete Suite to Enhance the End-User Experience Management
9 Underground Utility Mapping Market By Vertical (Page No. - 53)
9.1 Introduction
9.2 Oil and Gas
9.2.1 Underground Utility Mapping Helps Avoid Accidents and Provides Safety to Oil and Gas Pipelines
9.3 Electricity
9.3.1 Underground Utility Mapping Helps Get Accurate Information About Electric Lines
9.4 Government and Public Safety
9.4.1 Underground Utility Mapping Technology Helps Government and Public Sector in Efficient Designing and Planning of Urban and Rural Development
9.5 Construction
9.5.1 Underground Utility Mapping Technology Helps Accurately Scan and Analyze the Deterioration of Facilities/Structures, Bridges, Buildings, and Other Structures
9.6 Telecommunication
9.6.1 Emergence of 5g Technology to Increase the Demand for Underground Utility Mapping
9.7 Others
10 Underground Utility Mapping Market By Region (Page No. - 61)
10.1 Introduction
10.2 North America
10.2.1 United States
10.2.1.1 Presence of Large-Scale 3D Mapping Enterprises to Drive the Market Growth in the US
10.2.2 Canada
10.2.2.1 Government Initiatives Toward the Adoption of Utility Mapping Technology to Advocate the Growth of the Market in Canada
10.3 Europe
10.3.1 United Kingdom
10.3.1.1 Government Initiatives Toward the Maintenance of Underground Utilities to Drive the Market
10.3.2 Germany
10.3.2.1 Need for Rehabilitation of the Existing Degraded Structures, Including Roads, Bridges, Railways, and Waterways, Driving the Growth of the Market in Germany
10.3.3 France
10.3.3.1 Presence of Prominent Utility Mapping Service Providers to Drive the Market in France
10.3.4 Rest of Europe
10.4 Asia Pacific
10.4.1 China
10.4.1.1 Rising Economic Activities and Increasing Government Initiatives to Drive the Growth of Market in China
10.4.2 Japan
10.4.2.1 Adoption of Advanced Mapping Techniques to Drive Market in Japan
10.4.3 Australia and New Zealand
10.4.3.1 Government Initiatives and Usage of Underground Utility Mapping for Smart City Infrastructures to Enhance the Market in AnZ
10.4.4 Rest of Asia Pacific
10.5 Rest of the World
10.5.1 Latina America
10.5.1.1 Growing Demand for Utility Mapping in the Construction Industry to Drive the Market in Latin America
10.5.2 Middle East
10.5.2.1 Government Plans to Improve Urban Planning With Underground Utility Maps to Drive the Growth of Market in the Middle East
10.5.3 Africa
10.5.3.1 Advanced Technologies With Utility Maps to Improve Exploration Activities in the Oil and Gas Industry, to Drive the Growth of Underground Utility Mapping Market in Africa
11 Competitive Landscape (Page No. - 82)
11.1 Overview
11.2 Competitive Leadership Mapping
11.2.1 Visionary Leaders
11.2.2 Dynamic Differentiators
11.2.3 Innovators
11.2.4 Emerging Companies
11.3 Competitive Scenario
11.3.1 New Product/Service Launches, Service Expansions, and Product Upgrades
11.3.2 Partnerships and Collaborations
11.3.3 Mergers and Acquisitions
12 Company Profiles (Page No. - 89)
12.1 Hexagon Geosystems
(Business Overview, Solutions, Products & Services, Key Insights, Recent Developments, SWOT Analysis, MnM View)*
12.2 Sensors & Software
12.3 Vivax-Metrotech
12.4 Enviroscan
12.5 multiVIEW Locates
12.6 Guideline Geo
12.7 US Radar
12.8 Global Detection Solution
12.9 Plowman Craven
12.10 Geophysical Survey Systems, Inc
12.11 Prostar Geocorp
12.12 Underground Services (Softdig)
12.13 Utility Mapping
12.14 Maverick Inspection
12.15 Cardno
*Details on Business Overview, Solutions, Products & Services, Key Insights, Recent Developments, SWOT Analysis, MnM View Might Not be Captured in Case of Unlisted Companies.
13 Appendix (Page No. - 114)
13.1 Knowledge Store: Marketsandmarkets� Subscription Portal
13.2 Available Customizations
13.3 Related Reports
13.4 Author Details
List of Tables (50 Tables)
Table 1 Factor Analysis
Table 2 Underground Utility Mapping Market Size, By Component, 2017�2024 (USD Million)
Table 3 Technological Solutions: Market Size By Region, 2017�2024 (USD Million)
Table 4 Services: Market Size By Region, 2017�2024 (USD Million)
Table 5 Underground Utility Mapping Market Size, By Technological Solution, 2017�2024 (USD Million)
Table 6 Electromagnetic Induction: Market Size By Region, 2017�2024 (USD Thousand)
Table 7 Ground Penetrating Radar: Market Size By Region, 2017�2024 (USD Thousand)
Table 8 Others: Market Size By Region, 2017�2024 (USD Thousand)
Table 9 Underground Utility Mapping Market Size, By Service, 2017�2024 (USD Million)
Table 10 Professional Services: Market Size By Type, 2017�2024 (USD Million)
Table 11 Surveying and Mapping Market Size, By Region, 2017�2024 (USD Million)
Table 12 Training and Education Market Size, By Region, 2017�2024 (USD Thousand)
Table 13 Consulting Market Size, By Region, 2017�2024 (USD Thousand)
Table 14 Managed Services: Market Size By Region, 2017�2024 (USD Million)
Table 15 Underground Utility Mapping Market Size, By Vertical, 2017�2024 (USD Million)
Table 16 Oil and Gas: Market Size By Region, 2017�2024 (USD Million)
Table 17 Electricity: Market Size By Region, 2017�2024 (USD Thousand)
Table 18 Government and Public Safety: Market Size By Region, 2017�2024 (USD Million)
Table 19 Construction: Market Size By Region, 2017�2024 (USD Thousand)
Table 20 Telecommunication: Market Size By Region, 2017�2024 (USD Million)
Table 21 Others: Market Size By Region, 2017�2024 (USD Thousand)
Table 22 Underground Utility Mapping Market Size, By Region, 2017�2024 (USD Million)
Table 23 North America: Market Size By Component, 2017�2024 (USD Million)
Table 24 North America: Market Size By Technological Solution, 2017�2024 (USD Million)
Table 25 North America: Market Size By Service, 2017�2024 (USD Million)
Table 26 North America: Market Size By Professional Service, 2017�2024 (USD Million)
Table 27 North America: Market Size By Vertical, 2017�2024 (USD Million)
Table 28 North America: Market Size By Country, 2017�2024 (USD Million)
Table 29 Europe: Underground Utility Mapping Market Size, By Component, 2017�2024 (USD Million)
Table 30 Europe: Market Size By Technological Solution, 2017�2024 (USD Million)
Table 31 Europe: Market Size By Service, 2017�2024 (USD Million)
Table 32 Europe: Market Size By Professional Service, 2017�2024 (USD Million)
Table 33 Europe: Market Size By Vertical, 2017�2024 (USD Million)
Table 34 Europe: Market Size By Country, 2017�2024 (USD Million)
Table 35 Asia Pacific: Underground Utility Mapping Market Size, By Component, 2017�2024 (USD Million)
Table 36 Asia Pacific: Market Size By Technological Solution, 2017�2024 (USD Million)
Table 37 Asia Pacific: Market Size By Service, 2017�2024 (USD Million)
Table 38 Asia Pacific: Market Size By Professional Service, 2017�2024 (USD Thousand)
Table 39 Asia Pacific: Market Size By Vertical, 2017�2024 (USD Million)
Table 40 Asia Pacific: Market Size By Country, 2017�2024 (USD Million)
Table 41 Rest of the World: Underground Utility Mapping Market Size, By Component, 2017�2024 (USD Million)
Table 42 Rest of the World: Market Size By Technological Solution, 2017�2024 (USD Thousand)
Table 43 Rest of the World: Market Size By Service, 2017�2024 (USD Million)
Table 44 Rest of the World: Market Size By Professional Service, 2017�2024 (USD Thousand)
Table 45 Rest of the World: Market Size By Vertical, 2017�2024 (USD Million)
Table 46 Rest of the World: Market Size By Region, 2017�2024 (USD Million)
Table 47 Evaluation Criteria
Table 48 New Product/Service Launches, Service Expansions, and Product Upgrades, 2017�2018
Table 49 Partnerships and Collaborations, 2018�2019
Table 50 Mergers and Acquisitions, 2016�2018
List of Figures (39 Figures)
Figure 1 Underground Utility Mapping Market: Research Design
Figure 2 Market Top-Down and Bottom-Up Approaches
Figure 3 Market Top 3 Segments, 2019
Figure 4 Services Segment to Account for a Higher Market Share in 2019
Figure 5 Growing Concerns Over the Safety of Underground Assets and Increasing Advancements in the Utility Mapping Application to Drive the Growth of the Underground Utility Mapping Market
Figure 6 Services Segment and the US to Account for Higher Market Shares in 2019
Figure 7 Asia Pacific to Grow at the Highest CAGR During the Forecast Period
Figure 8 Asia Pacific to Emerge as the Best Market for Investments Over the Next 5 Years
Figure 9 Drivers, Restraints, Opportunities, and Challenges: Underground Utility Mapping Market
Figure 10 Services Segment to Dominate the Market in 2019
Figure 11 North America to Dominate the Technological Solutions Segment in the Underground Utility Mapping Market During the Forecast Period
Figure 12 Asia Pacific to Grow at the Highest CAGR During the Forecast Period
Figure 13 Electromagnetic Induction Segment to Have the Largest Market Size During the Forecast Period
Figure 14 Asia Pacific to Grow at the Highest CAGR During the Forecast Period
Figure 15 North America to Have Largest Market Size During the Forecast Period
Figure 16 Professional Services Segment to Grow at a Higher CAGR During the Forecast Period
Figure 17 Surveying and Mapping Segment to Dominate the Professional Services Segment During the Forecast Period
Figure 18 Asia Pacific to Grow at the Highest CAGR During the Forecast Period
Figure 19 North America to Dominate the Managed Services Segment During the Forecast Period
Figure 20 Government and Public Safety Segment to Have the Highest CAGR During the Forecast Period
Figure 21 North America to Dominate Overall Government and Public Safety Market Share During the Forecast Period
Figure 22 Asia Pacific to Grow at the Highest CAGR During the Forecast Period
Figure 23 Asia Pacific to Hold the Highest CAGR During the Forecast Period
Figure 24 North America: Market Snapshot
Figure 25 Services Segment to Hold a Larger Market Size During the Forecast Period
Figure 26 The US to Hold a Larger Market Size During the Forecast Period
Figure 27 Services Segment to Hold a Larger Market Size During the Forecast Period
Figure 28 Asia Pacific: Market Snapshot
Figure 29 Services Segment to Grow at a Higher CAGR During the Forecast Period
Figure 30 Services Segment to Hold a Larger Market Size During the Forecast Period
Figure 31 Underground Utility Mapping Market (Global), Competitive Leadership Mapping, 2019
Figure 32 Key Developments By the Leading Players in the Market During 2016�2019
Figure 33 Hexagon Geosystems: Company Snapshot
Figure 34 Hexagon Geosystems: SWOT Analysis
Figure 35 Sensors & Software: SWOT Analysis:
Figure 36 Vivax-Metrotech: SWOT Analysis
Figure 37 Guideline Geo: Company Snapshot
Figure 38 Guideline Geo: SWOT Analysis
Figure 39 Geophysics Survey Systems, Inc.: SWOT Analysis:
The study involved four major steps to estimate the current market size for the underground utility mapping market. The exhaustive secondary research was done to collect information on the market, the peer market, and the parent market. The next step was to validate these findings, assumptions, and sizing with industry experts across value chain through primary research. Both top-down and bottom-up approaches were employed to estimate the complete market size. Thereafter, market breakdown and data triangulation were used to estimate the market size of segments and sub segments.
Secondary Research
In the secondary research process, various secondary sources were referred to for identifying and collecting information for the study. The secondary sources included annual reports, press releases, and investor presentations of companies; and white papers, technology journals, certified publications, and articles from recognized authors, directories, and databases. Secondary research was mainly used to obtain vital information about the industry�s supply chain, the market�s monetary chain, the total pool of key players, market classification and segmentation according to industry trends to the bottom-most level, geographic markets, and key developments from both market- and technology-oriented perspectives.
Primary Research
In the primary research process, various primary sources from both supply and demand sides were interviewed to obtain qualitative and quantitative information for the report. The primary sources from the supply side included industry experts, such as Chief Executive Officers (CEOs), Vice Presidents (VPs), marketing directors, technology & innovation directors, and related key executives from various key companies and organizations providing underground utility mapping solutions. The primary sources from the demand side included end-users, such as Chief Information Officers (CIOs), consultants, service professionals, technicians and technologists, and managers at public- and investor-owned utilities.
After the complete market engineering (including calculations for market statistics, market breakup, market size estimations, market forecasting, and data triangulation) process, extensive primary research was conducted to gather information and verify and validate the deduced critical numbers. Primary research was also conducted to identify the segmentation types; industry trends; key players; the competitive landscape of different market players; and key market dynamics, such as drivers, restraints, opportunities, challenges, industry trends, and key strategies. Following is the breakdown of primary respondents:
To know about the assumptions considered for the study, download the pdf brochure
Underground Utility Mapping Market Size Estimation
Both top-down and bottom-up approaches were used to estimate and validate the overall size of the underground utility mapping market. These methods were also used extensively to estimate the size of various sub-segments in the market. The research methodology used to estimate the market size includes the following:
- The key players in the industry and markets have been identified through extensive secondary research.
- The underground utility mapping market expenditures across regions, along with the geographic split in various segments have been considered to arrive at the overall market size.
- All percentage shares, splits, and breakdowns have been determined using secondary sources and verified through primary sources.
Data Triangulation
After arriving at the overall market size � using the market size estimation processes as explained above � the market was split into several segments and subsegments. To complete the overall market engineering process and arrive at the exact statistics of each market segment and subsegment, data triangulation, and market breakup procedures were employed, wherever applicable. The data was triangulated by studying various factors and trends from both the demand and supply sides in the underground utility mapping industry.
Report Objectives:
- To define, describe, and forecast the underground utility mapping market by component (technological solutions and services), vertical, and region
- To provide detailed information about major factors (drivers, restraints, opportunities, and industry-specific challenges) influencing the market growth
- To analyze growth opportunities in the market and provide details of the competitive landscape of stakeholders and market leaders
- To forecast the market size of the segments with respect to 4 main regions, namely North America, Europe, Asia Pacific (APAC), and Rest of the World (RoW)
- To profile the key players in the market and comprehensively analyze their market rankings and core competencies1
- To analyze competitive developments, such as new partnerships, contracts, and product developments, in the market
1Micromarkets are defined as further segments and subsegments of the global underground utility mapping market included in the report.
2Core competencies of the companies have been captured in terms of their key developments and key strategies adopted by them to sustain their positions in the market.
Available Customizations
With the given market data, MarketsandMarkets offers customizations as per the company�s specific needs. The following customization options are available for the report:
Geographic Analysis
- Further breakdown of the North American market into the US and Canada
- Further breakdown of the European market into the UK, Germany, France, and Rest of Europe
- Further breakup of the APAC market into China, Japan, Australia and New Zealand (ANZ) and Rest of APAC
- Further breakup of the RoW market into Latin America, the Middle East & Africa
Company Information
- Detailed analysis and profiling of additional market players


Growth opportunities and latent adjacency in Underground Utility Mapping Market