Model Based Enterprise Market

Model Based Enterprise Market by Offering (Solutions, Services), Deployment Type (On-premise, Cloud), Industry (Aerospace, Automotive, Construction, Power & Energy, Food & Beverages, Life Sciences & Healthcare, Marine), Region - Global Forecast to 2029

Report Code: SE 6831 Apr, 2024, by marketsandmarkets.com

[213 Pages Report] The global model based enterprise market size is expected to grow from USD 13.6 billion in 2024 to USD 27.1 billion by 2029, at a CAGR of 14.9% from 2024 to 2029.

3D printing technology plays a vital role in design and manufacturing processes. Digital 3D models are replacing traditional paper drawings and blueprints because these models contain more information and can be reused by multiple applications. Hence, the use of 3D printing is growing significantly at present, and this technology also has the potential to change the manufacturing and supply chain management processes. Initially, 2D designs were used; however, there was no connectivity or collaboration within the enterprise. Therefore, a 3D master is created to use as a reference point, which can be circulated throughout the enterprise using a neutral format such as 3D PDF, JT, or STEP. Thus, digital information technology enables engineers and technicians in remote locations to access computer-aided design (CAD) models, diagrams, and engineering data, which is critical for the maintenance and repair of complex systems.
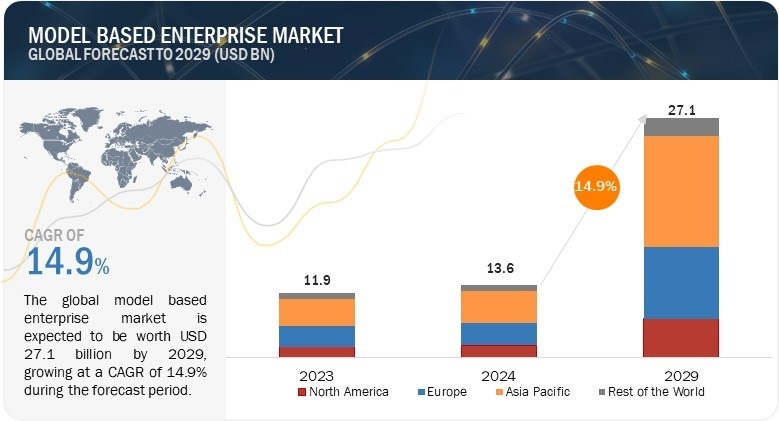
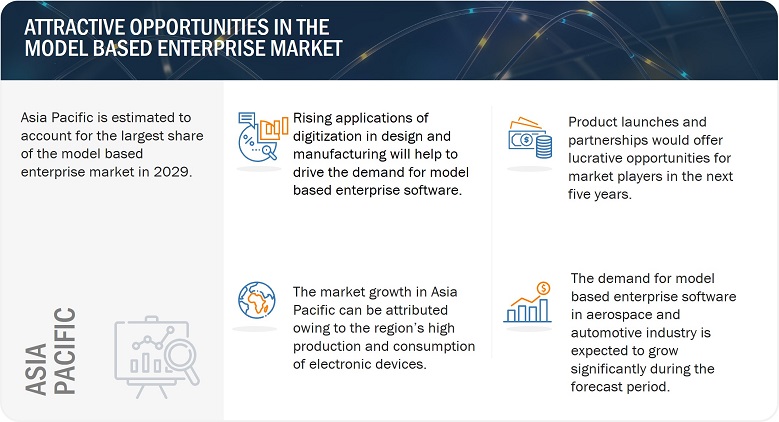
Model Based Enterprise Market

Model Based Enterprise Market

Model Based Enterprise Market Forecast to 2029

To know about the assumptions considered for the study, Request for Free Sample Report

Market Dynamics

DRIVERS: Increasing adoption of cloud-based platforms

The growing popularity of different types of IoT cloud platforms, such as IoT Azure, IoT Watson, and Predix, in various industries, eventually increasing the need for model based engineering. The emergence of IoT allows the connection of a simulation model of the product or process with sensors, which capture data, and actuators, which control the process operations, using the Internet and also helps MBE to enable 3D annotation data modeling. Thus, the IoT and model-based engineering are expected to continue to play a vital role in the design, fabrication, and maintenance of complex products in the near future.

RESTRAINTS: Difficulties in migration from on-premises to cloud-based platform

Enterprise resource planning (ERP) and product life cycle management (PLM) are two essential applications of model based enterprise. Each enterprise system can either be deployed on premise or cloud. Although the cloud-based platform is increasingly being adopted, the on-premise platform is beneficial in terms of data privacy because on-premise software is installed locally, on a company's computers and servers, which restricts any third party to access this data. Moreover, transitioning from the existing on-premise PLM solutions to cloud-based PLM systems requires time and efforts. The support team requires a good amount of time to move the infrastructure and implement cloud-based technologies, resulting in high cost and rework.

OPPORTUNITIES: Rising adoption of digital twin and digital thread technologies

Digital twins have advantages in terms of technology, data and analytics, and innovation, which helps several worldwide industries to grow. At present, many companies have been transforming data collection and analytics, organization, and IT infrastructure to increase their performance agility. Principle and framework of digital twins contribute to creating individual digital projects for organizations and companies. The concept of digital twin can drive other digital initiatives taken by many organizations. Additionally, the digital thread concept was derived from 3D models and simulation tools. With the development of new technologies, these tools are becoming more practical to deploy and can be connected using the digital thread. These digital threads provide the communications framework that allows a connected data flow and integrated view of the asset data throughout its life cycle, which is then structured, revision controlled, and analyzed. MBE comprises model-based definition (MBD), created by engineering function to complete model-based manufacturing and model-based inspection activities.

CHALLENGES: Lack of security issues associated with MBE online platform

MBE is often started as a pilot project with limited resources and clients. However, MBE solutions and services grow with time. With that, data management and storage requirements also grow, along with the adoption of PLM. More value is placed on data software than hardware. However, it requires high security. Both large enterprises and SMEs are reluctant when it comes to storing data on cloud-based platforms because of the rise in data security issues in cloud-based processes over time. Cloud processes, such as PLM, ERP, and IoT, need to be monitored continuously to minimize risks and improve security features. Natural or man-made disasters also pose a threat to data centers, and loss of internet connectivity may bring the entire process to a standstill.

Model Based Enterprise Market Ecosystem

Prominent companies in this market include well-established, financially stable software providers such as Siemens (Germany), PTC (US), Dassault Systèmes (France), SAP (Germany), Autodesk Inc. (US), HCL Technologies Limited (India), and Oracle (US). These companies have been operating in the market for several years and possess a diversified product portfolio and strong global sales and marketing networks. Along with the well-established companies, there are a large number of small and medium companies operating in this market, such as Infor (US) and Aras (US).
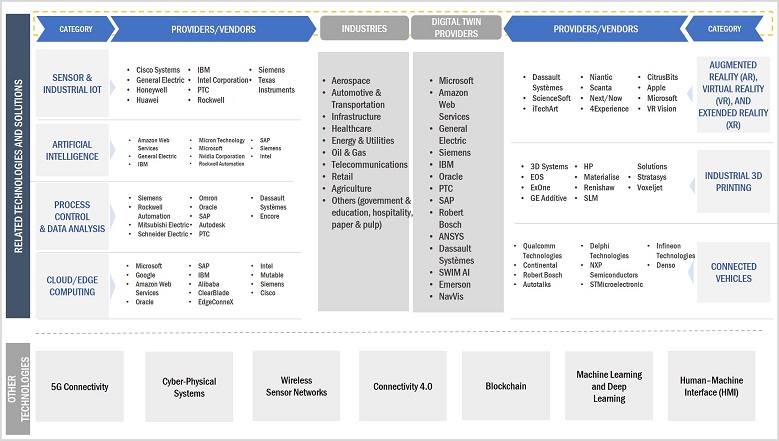
Model Based Enterprise Market by Ecosystem

Solutions segment is expected to grow with significant CAGR during the forecast period.

The software used in MBE provides comprehensive service provisioning, monitoring, and troubleshooting capabilities. The segment includes product management and planning software, and virtualization software having model exchange validation, processing, intelligence, as well as networking capabilities. The software enhances the performance of modeling software and provides operational simplicity of physical and virtual infrastructure in modeling software applications. Moreover, model based system engineering (MBSE) tools are used to manage a large volume of unstructured data related to design requirements, and model based design (MBD) tools allow engineers to develop the conceptual design of the system to address those requirements.

The market for aerospace segment is projected to hold substantial market share during the forecast period.

Aerospace manufacturers efficiently manage and securely share digital products and associated information with companies involved in the product development cycle. Also, the cloud platform is rapidly adopted in this industry due to its security, cost-saving, and scalability features. The aerospace & defense industry is always keen to acquire new technologies. It requires flexible and scalable infrastructure, which is made available by cloud services. Hence, the aerospace industry can serve customers in a better way by employing cloud-based MBE solutions. In Collins Aerospace, the Model-Based Systems Engineering (MBSE) division devises methodologies and technologies to ensure the systematic and uniform utilization of models across the entirety of aerospace system engineering endeavors, encompassing hardware, software, air-to-ground communications, AI-driven systems, and mechanical elements. Similarly, HCL Technologies Limited offers Model Based Enterprise 2.0 solution for aerospace & defense in which PLM, MES, and ERP are included.

The market in Asia Pacific is projected to hold the substantial market share in 2029.
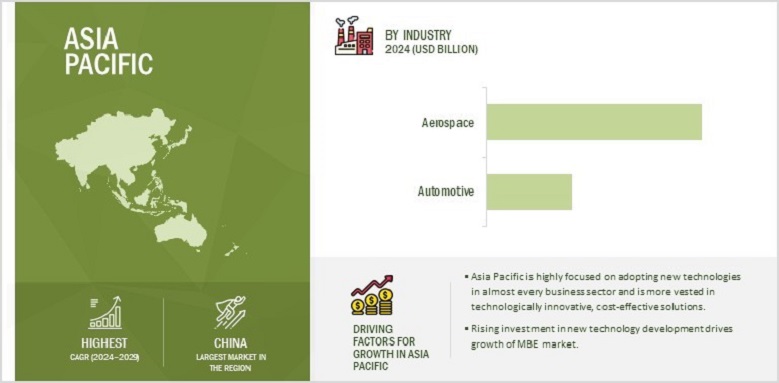
Model Based Enterprise Market by Region

Model Based Enterprise Market by Region

To know about the assumptions considered for the study, download the pdf brochure

Asia Pacific is witnessing dynamic changes in the adoption of new technologies and advancements in the manufacturing sector. The region is expected to experience widespread growth opportunities during the forecast period. The region is highly focused on adopting new technologies in almost every business sector and is more vested in technologically innovative, cost-effective solutions. Though various countries are slowly adopting MBE solutions, economic globalization, and the need to reduce the capital expenditure are the major factors pushing Asia Pacific countries to implement MBE solutions. The Chinese government is actively adopting new and improved manufacturing strategies to develop its manufacturing sector, and reform and strengthen various industries based in China. Chinese manufacturing enterprises have been spending heavily on the IoT, which would increase the need for MBE for minimizing designing paperwork, improving the efficiency of products, optimizing manufacturing and processes, and so on. Thus, the increasing expenditure on developing new technologies boosts the growth of the MBE market in the near future.

Top Model Based Enterprise Companies - Key Market Players:

Siemens (Germany), PTC (US), Dassault Systèmes (France), SAP (Germany), Autodesk Inc. (US), HCL Technologies Limited (India), and Oracle (US) are among a few top players in the model based enterprise companies.

 Model Based Enterprise Makret Report Scope : 

Report Metric

Details

Estimated Market Size  USD 13.6 billion in 2024
Projected Market Size USD 27.1 billion by 2029
Growth Rate CAGR of   14.9%

Market Size Available for Years

2020–2029

Base Year

2023

Forecast Period

2024–2029

Units

Value (USD Million/Billion)

Segments Covered

  • By Offering,
  • By Deployment Type, and
  • By Industry

Geographic Regions Covered

  • North America,
  • Europe,
  • Asia Pacific, and
  • RoW

Companies Covered

Major Players:  Siemens (Germany), PTC (US), Dassault Systèmes (France), SAP (Germany), Autodesk Inc. (US), HCL Technologies Limited (India), Oracle (US), Wipro (India), ANSYS, Inc (US), Bentley Systems, Incorporated (US) and Others - (Total 25 players have been covered)

Model Based Enterprise Market Highlights

This research report categorizes the model based enterprise market by offering, deployment type, industry, and region.

Segment

Subsegment

By Offering:

  • Solutions
  • Services

By Deployment Type:

  • Cloud
  • On-premise

By Industry:

  • Aerospace
  • Automotive
  • Construction
  • Retail
  • Power & Energy
  • Food & Beverages
  • Life Sciences & Healthcare
  • Marine
  • Oil & Gas
  • Electronics & Telecommunications
  • Other Industries

By Region

  • North America
    • US
    • Canada
    • Mexico
  • Europe
    • Germany
    • UK
    • France
    • Rest of Europe
  • Asia Pacific
    • China
    • Japan
    • India
    • South Korea
    • Australia
    • Rest of Asia Pacific
  • Rest of the World
  • Middle East
  • South America
  • Africa

Recent Developments in Model Based Enterprise Industry : 

  • In February 2024, Cadence Design Systems, Inc. and Dassault Systèmes announced the extension in their ongoing strategic partnership by integrating the AI-driven Cadence OrCAD X and Allegro X with Dassault Systèmes’ extended 3DEXPERIENCE Works portfolio, for SOLIDWORKS existing and future customers.
  • In May 2023, SAP extended its partnership with Google Cloud. This partnership will help to make enterprise data more open and valuable. In addition, it will help in advance enterprise AI development.
  • In March 2023, PTC announced the launch of its Creo+ software as a service (SaaS) computer-aided design (CAD) solution and the tenth version of its Creo CAD software. Creo+ has the proven functionality of Creo with new cloud-based tools to improve design collaboration and simplify CAD administration.

Frequently Asked Questions(FAQs):

To speak to our analyst for a discussion on the above findings, click Speak to Analyst

TABLE OF CONTENTS
 
1 INTRODUCTION (Page No. - 28)
    1.1 STUDY OBJECTIVES 
    1.2 MARKET DEFINITION 
    1.3 STUDY SCOPE 
           1.3.1 MARKETS COVERED
                    FIGURE 1 MODEL-BASED ENTERPRISE MARKET SEGMENTATION
           1.3.2 REGIONAL SCOPE
           1.3.3 INCLUSIONS AND EXCLUSIONS
           1.3.4 YEARS CONSIDERED
    1.4 CURRENCY CONSIDERED 
    1.5 STAKEHOLDERS 
    1.6 SUMMARY OF CHANGES 
    1.7 IMPACT OF RECESSION 
 
2 RESEARCH METHODOLOGY (Page No. - 33)
    2.1 RESEARCH DATA 
           FIGURE 2 MODEL-BASED ENTERPRISE MARKET: RESEARCH DESIGN
           2.1.1 SECONDARY AND PRIMARY RESEARCH
                    FIGURE 3 MODEL-BASED ENTERPRISE MARKET: RESEARCH APPROACH
           2.1.2 SECONDARY DATA
                    2.1.2.1 List of key secondary sources
                    2.1.2.2 Key data from secondary sources
           2.1.3 PRIMARY DATA
                    2.1.3.1 List of primary interview participants
                    2.1.3.2 Key data from primary sources
                    2.1.3.3 Key industry insights
                    2.1.3.4 Breakdown of primaries
    2.2 MARKET SIZE ESTIMATION METHODOLOGY 
           2.2.1 TOP-DOWN APPROACH
                    2.2.1.1 Approach to derive market size using top-down analysis (supply side)
                               FIGURE 4 MODEL-BASED ENTERPRISE MARKET: TOP-DOWN APPROACH
           2.2.2 BOTTOM-UP APPROACH
                    2.2.2.1 Approach to derive market size using bottom-up analysis (demand side)
                               FIGURE 5 MODEL-BASED ENTERPRISE MARKET: BOTTOM-UP APPROACH
                               FIGURE 6 MODEL-BASED ENTERPRISE MARKET SIZE ESTIMATION METHODOLOGY
    2.3 MARKET BREAKDOWN AND DATA TRIANGULATION 
           FIGURE 7 MODEL-BASED ENTERPRISE MARKET: DATA TRIANGULATION
    2.4 RESEARCH ASSUMPTIONS 
           FIGURE 8 MODEL-BASED ENTERPRISE MARKET: RESEARCH ASSUMPTIONS
    2.5 RESEARCH LIMITATIONS 
    2.6 PARAMETERS CONSIDERED TO ANALYZE IMPACT OF RECESSION ON MODEL-BASED ENTERPRISE MARKET 
           TABLE 1 MODEL-BASED ENTERPRISE MARKET: PARAMETERS CONSIDERED TO ANALYZE IMPACT OF RECESSION ON MODEL-BASED ENTERPRISE MARKET
    2.7 RISK ASSESSMENT 
           TABLE 2 MODEL-BASED ENTERPRISE MARKET: RISK ASSESSMENT
 
3 EXECUTIVE SUMMARY (Page No. - 44)
    FIGURE 9 MODEL-BASED ENTERPRISE MARKET SIZE, 2020–2029 (USD MILLION)
    FIGURE 10 SOLUTIONS TO ACCOUNT FOR LARGER SHARE OF MODEL-BASED ENTERPRISE MARKET IN 2029
    FIGURE 11 ON-PREMISES DEPLOYMENT TYPE HELD LARGER MARKET SHARE IN 2024
    FIGURE 12 AEROSPACE INDUSTRY TO HOLD LARGEST MARKET SHARE IN 2024
    FIGURE 13 ASIA PACIFIC TO REGISTER HIGHEST CAGR DURING FORECAST PERIOD
 
4 PREMIUM INSIGHTS (Page No. - 48)
    4.1 ATTRACTIVE OPPORTUNITIES FOR PLAYERS IN MODEL-BASED ENTERPRISE MARKET 
           FIGURE 14 RAPID DIGITIZATION IN DESIGN AND MANUFACTURING TO OFFER LUCRATIVE OPPORTUNITIES FOR PLAYERS IN MODEL-BASED ENTERPRISE MARKET
    4.2 MODEL-BASED ENTERPRISE MARKET, BY OFFERING 
           FIGURE 15 SOLUTIONS TO DOMINATE MODEL-BASED ENTERPRISE MARKET DURING FORECAST PERIOD
    4.3 MODEL-BASED ENTERPRISE MARKET, BY INDUSTRY 
           FIGURE 16 AEROSPACE INDUSTRY TO ACCOUNT FOR LARGEST MARKET SHARE IN 2029
    4.4 MODEL-BASED ENTERPRISE MARKET IN NORTH AMERICA, BY INDUSTRY AND COUNTRY 
           FIGURE 17 AEROSPACE INDUSTRY AND US HELD LARGEST SHARES OF MODEL-BASED ENTERPRISE MARKET IN NORTH AMERICA IN 2023
    4.5 MODEL-BASED ENTERPRISE MARKET, BY COUNTRY 
           FIGURE 18 INDIA TO REGISTER HIGHEST CAGR BETWEEN 2024 AND 2029
 
5 MARKET OVERVIEW (Page No. - 51)
    5.1 INTRODUCTION 
    5.2 MARKET DYNAMICS 
           FIGURE 19 MODEL-BASED ENTERPRISE MARKET: DRIVERS, RESTRAINTS, OPPORTUNITIES, AND CHALLENGES
           5.2.1 DRIVERS
                    5.2.1.1 Digitization of manufacturing sector
                    5.2.1.2 Improvements in model-based enterprise capabilities
                    5.2.1.3 Growing adoption of cloud-based platforms in various industries
                               FIGURE 20 IMPACT ANALYSIS: DRIVERS
           5.2.2 RESTRAINTS
                    5.2.2.1 Difficulties in shifting from on-premises to cloud-based platforms
                               FIGURE 21 IMPACT ANALYSIS: RESTRAINTS
           5.2.3 OPPORTUNITIES
                    5.2.3.1 Rising adoption of model-based enterprises in aerospace industry to enhance product development
                    5.2.3.2 Increasing demand for digital twin and digital thread technologies in various industries
                               FIGURE 22 IMPACT ANALYSIS: OPPORTUNITIES
           5.2.4 CHALLENGES
                    5.2.4.1 Limited awareness regarding model-based enterprise capabilities
                    5.2.4.2 Security issues associated with model-based enterprise online platforms
                               FIGURE 23 IMPACT ANALYSIS: CHALLENGES
    5.3 TRENDS/DISRUPTIONS IMPACTING CUSTOMERS’ BUSINESSES 
           FIGURE 24 TRENDS/DISRUPTIONS IMPACTING CUSTOMERS’ BUSINESSES
    5.4 PRICING ANALYSIS 
           5.4.1 INDICATIVE SELLING PRICE OF MODEL-BASED ENTERPRISE SOFTWARE
                    FIGURE 25 INDICATIVE SELLING PRICE OF MODEL-BASED ENTERPRISE SOFTWARE, 2020–2023 (USD)
           5.4.2 INDICATIVE SELLING PRICE OF MODEL-BASED ENTERPRISE SOFTWARE OFFERED BY THREE KEY PLAYERS
                    FIGURE 26 INDICATIVE SELLING PRICE OF MODEL-BASED ENTERPRISE SOFTWARE OFFERED BY THREE KEY PLAYERS (USD)
                    TABLE 3 INDICATIVE SELLING PRICE OF MODEL-BASED ENTERPRISE SOFTWARE OFFERED BY THREE KEY PLAYERS (USD)
           5.4.3 INDICATIVE SELLING PRICE OF MODEL-BASED ENTERPRISE SOFTWARE OFFERED BY SEVEN KEY PLAYERS
                    TABLE 4 INDICATIVE SELLING PRICE OF MODEL-BASED ENTERPRISE SOFTWARE OFFERED BY SEVEN KEY PLAYERS (USD)
           5.4.4 INDICATIVE SELLING PRICE OF MODEL-BASED ENTERPRISE SOFTWARE, BY REGION
                    TABLE 5 INDICATIVE SELLING PRICE OF MODEL-BASED ENTERPRISE SOFTWARE, BY REGION (USD)
    5.5 VALUE CHAIN ANALYSIS 
           FIGURE 27 MODEL-BASED ENTERPRISE MARKET: VALUE CHAIN ANALYSIS
    5.6 ECOSYSTEM ANALYSIS 
           FIGURE 28 MODEL-BASED ENTERPRISE MARKET: ECOSYSTEM MAPPING
           TABLE 6 ROLE OF COMPANIES IN MODEL-BASED ENTERPRISE ECOSYSTEM
    5.7 INVESTMENT AND FUNDING SCENARIO 
           FIGURE 29 MODEL-BASED ENTERPRISE MARKET: INVESTMENT AND FUNDING SCENARIO, 2017–2022 (USD MILLION)
    5.8 TECHNOLOGY ANALYSIS 
           5.8.1 KEY TECHNOLOGY
                    5.8.1.1 Model-based design and engineering (MBDE)
                    5.8.1.2 Digital twin
           5.8.2 COMPLEMENTARY TECHNOLOGY
                    5.8.2.1 Cloud-based solution
           5.8.3 ADJACENT TECHNOLOGY
                    5.8.3.1 5G
                    5.8.3.2 Artificial intelligence (AI) and machine learning (ML)
    5.9 PATENT ANALYSIS 
           FIGURE 30 TOP 10 PATENT APPLICANTS IN LAST 10 YEARS, 2014–2023
           TABLE 7 TOP 20 PATENT OWNERS IN US IN LAST 10 YEARS, 2014–2023
           FIGURE 31 NUMBER OF PATENTS GRANTED PER YEAR, 2016–2023
           TABLE 8 INNOVATIONS AND PATENT REGISTRATIONS PERTAINING TO MODEL-BASED ENTERPRISE SOFTWARE, 2021–2023
    5.10 TRADE ANALYSIS 
           5.10.1 IMPORT SCENARIO
                    FIGURE 32 IMPORT DATA FOR HS CODE 8471-COMPLIANT PRODUCTS, BY COUNTRY, 2019–2023 (USD MILLION)
           5.10.2 EXPORT SCENARIO
                    FIGURE 33 EXPORT DATA FOR HS CODE 8471-COMPLIANT PRODUCTS, BY COUNTRY, 2019–2023 (USD MILLION)
    5.11 KEY CONFERENCES AND EVENTS, 2024–2025 
           TABLE 9 MODEL-BASED ENTERPRISE MARKET: KEY CONFERENCES AND EVENTS, 2024–2025
    5.12 CASE STUDY ANALYSIS 
           5.12.1 ZEISS AND PTC COLLABORATED ON KNOWLEDGE-TRANSFER PROJECT TO BRIDGE GAP BETWEEN DESIGN AND QUALITY CONTROL
           5.12.2 AIRBUS ADOPTED SIEMENS’S DIGITAL PRODUCT DESIGN AND MANUFACTURING SOLUTION TO IMPLEMENT MBSE APPROACH TO MANAGE COMPLEX DEVELOPMENT OF A350 XWB AIRCRAFT
           5.12.3 NEPTUNE IMPLEMENTED PTC LEARN PLATFORM TO TRAIN ENGINEERS ON CAD SOFTWARE
    5.13 REGULATORY LANDSCAPE AND STANDARDS 
           5.13.1 REGULATORY BODIES, GOVERNMENT AGENCIES, AND OTHER ORGANIZATIONS
                    TABLE 10 NORTH AMERICA: LIST OF REGULATORY BODIES, GOVERNMENT AGENCIES, AND OTHER ORGANIZATIONS
                    TABLE 11 EUROPE: LIST OF REGULATORY BODIES, GOVERNMENT AGENCIES, AND OTHER ORGANIZATIONS
                    TABLE 12 ASIA PACIFIC: LIST OF REGULATORY BODIES, GOVERNMENT AGENCIES, AND OTHER ORGANIZATIONS
                    TABLE 13 ROW: LIST OF REGULATORY BODIES, GOVERNMENT AGENCIES, AND OTHER ORGANIZATIONS
           5.13.2 STANDARDS
                    TABLE 14 MODEL-BASED ENTERPRISE MARKET: STANDARDS
    5.14 PORTER’S FIVE FORCES ANALYSIS 
           TABLE 15 MODEL-BASED ENTERPRISE MARKET: PORTER’S FIVE FORCES ANALYSIS
           FIGURE 34 MODEL-BASED ENTERPRISE MARKET: PORTER’S FIVE FORCES ANALYSIS
           5.14.1 BARGAINING POWER OF SUPPLIERS
           5.14.2 BARGAINING POWER OF BUYERS
           5.14.3 THREAT OF NEW ENTRANTS
           5.14.4 THREAT OF SUBSTITUTES
           5.14.5 INTENSITY OF COMPETITIVE RIVALRY
    5.15 KEY STAKEHOLDERS AND BUYING CRITERIA 
           5.15.1 KEY STAKEHOLDERS IN BUYING PROCESS
                    FIGURE 35 MODEL-BASED ENTERPRISE MARKET: INFLUENCE OF STAKEHOLDERS ON BUYING PROCESS FOR TOP THREE INDUSTRIES
                    TABLE 16 MODEL-BASED ENTERPRISE MARKET: INFLUENCE OF STAKEHOLDERS ON BUYING PROCESS FOR TOP THREE INDUSTRIES
           5.15.2 BUYING CRITERIA
                    FIGURE 36 MODEL-BASED ENTERPRISE MARKET: KEY BUYING CRITERIA FOR TOP THREE INDUSTRIES
                    TABLE 17 MODEL-BASED ENTERPRISE MARKET: KEY BUYING CRITERIA FOR TOP THREE INDUSTRIES
 
6 MODEL-BASED ENTERPRISE MARKET, BY OFFERING (Page No. - 75)
    6.1 INTRODUCTION 
           FIGURE 37 MODEL-BASED ENTERPRISE MARKET, BY OFFERING
           FIGURE 38 SERVICES TO EXHIBIT HIGHER CAGR IN MODEL-BASED ENTERPRISE MARKET FROM 2024 TO 2029
           TABLE 18 MODEL-BASED ENTERPRISE MARKET, BY OFFERING, 2020–2023 (USD MILLION)
           TABLE 19 MODEL-BASED ENTERPRISE MARKET, BY OFFERING, 2024–2029 (USD MILLION)
    6.2 SOLUTIONS 
           6.2.1 DEVELOPMENT OF COMPUTER-AIDED DESIGN SOLUTIONS TO FACILITATE COLLABORATIONS ON PRODUCT DEVELOPMENT TO DRIVE MARKET
                    TABLE 20 SOLUTIONS: MODEL-BASED ENTERPRISE MARKET, BY INDUSTRY, 2020–2023 (USD MILLION)
                    TABLE 21 SOLUTIONS: MODEL-BASED ENTERPRISE MARKET, BY INDUSTRY, 2024–2029 (USD MILLION)
                    TABLE 22 SOLUTIONS: MODEL-BASED ENTERPRISE MARKET, BY REGION, 2020–2023 (USD MILLION)
                    TABLE 23 SOLUTIONS: MODEL-BASED ENTERPRISE MARKET, BY REGION, 2024–2029 (USD MILLION)
    6.3 SERVICES 
           6.3.1 NEED TO ENHANCE EFFICIENCY OF PRODUCT MANAGEMENT PROCESS TO BOOST SEGMENTAL GROWTH
           6.3.2 PROFESSIONAL SERVICES
                    6.3.2.1 Consulting & integration services
                    6.3.2.2 Training, support & maintenance services
           6.3.3 MANAGED SERVICES
                    TABLE 24 SERVICES: MODEL-BASED ENTERPRISE MARKET, BY INDUSTRY, 2020–2023 (USD MILLION)
                    TABLE 25 SERVICES: MODEL-BASED ENTERPRISE MARKET, BY INDUSTRY, 2024–2029 (USD MILLION)
                    TABLE 26 SERVICES: MODEL-BASED ENTERPRISE MARKET, BY REGION, 2020–2023 (USD MILLION)
                    TABLE 27 SERVICES: MODEL-BASED ENTERPRISE MARKET, BY REGION, 2024–2029 (USD MILLION)
 
7 MODEL-BASED ENTERPRISE MARKET, BY DEPLOYMENT TYPE (Page No. - 84)
    7.1 INTRODUCTION 
           FIGURE 39 MODEL-BASED ENTERPRISE MARKET, BY DEPLOYMENT TYPE
           FIGURE 40 ON-PREMISES DEPLOYMENT TYPE TO HOLD LARGER SHARE OF MODEL-BASED ENTERPRISE MARKET IN 2029
           TABLE 28 MODEL-BASED ENTERPRISE MARKET, BY DEPLOYMENT TYPE, 2020–2023 (USD MILLION)
           TABLE 29 MODEL-BASED ENTERPRISE MARKET, BY DEPLOYMENT TYPE, 2024–2029 (USD MILLION)
    7.2 ON-PREMISES 
           7.2.1 HIGH PREFERENCE FOR ON-PREMISES MODEL-BASED ENTERPRISE DEPLOYMENT FOR ENHANCED DATA SECURITY TO FOSTER SEGMENTAL GROWTH
    7.3 CLOUD-BASED 
           7.3.1 RISING POPULARITY OF CLOUD-BASED DEPLOYMENT MODELS TO FACILITATE COST-EFFICIENT DATA INTEGRATION TO DRIVE MARKET
 
8 MODEL-BASED ENTERPRISE MARKET, BY INDUSTRY (Page No. - 88)
    8.1 INTRODUCTION 
           FIGURE 41 MODEL-BASED ENTERPRISE MARKET, BY INDUSTRY
           FIGURE 42 AEROSPACE INDUSTRY TO HOLD LARGEST MARKET SHARE IN 2029
           TABLE 30 MODEL-BASED ENTERPRISE MARKET, BY INDUSTRY, 2020–2023 (USD MILLION)
           TABLE 31 MODEL-BASED ENTERPRISE MARKET, BY INDUSTRY, 2024–2029 (USD MILLION)
    8.2 AEROSPACE 
           8.2.1 RISING ADOPTION OF DIGITAL TECHNOLOGIES IN AIRCRAFT PART MANUFACTURING TO FUEL SEGMENTAL GROWTH
                    TABLE 32 AEROSPACE: MODEL-BASED ENTERPRISE MARKET, BY OFFERING, 2020–2023 (USD MILLION)
                    TABLE 33 AEROSPACE: MODEL-BASED ENTERPRISE MARKET, BY OFFERING, 2024–2029 (USD MILLION)
                    TABLE 34 AEROSPACE: MODEL-BASED ENTERPRISE MARKET, BY REGION, 2020–2023 (USD MILLION)
                    TABLE 35 AEROSPACE: MODEL-BASED ENTERPRISE MARKET, BY REGION, 2024–2029 (USD MILLION)
    8.3 AUTOMOTIVE 
           8.3.1 INCREASING INNOVATIONS IN AUTOMOBILES AND COMPETITIVE PRESSURE TO DRIVE DEMAND
                    TABLE 36 AUTOMOTIVE: MODEL-BASED ENTERPRISE MARKET, BY OFFERING, 2020–2023 (USD MILLION)
                    TABLE 37 AUTOMOTIVE: MODEL-BASED ENTERPRISE MARKET, BY OFFERING, 2024–2029 (USD MILLION)
                    TABLE 38 AUTOMOTIVE: MODEL-BASED ENTERPRISE MARKET, BY REGION, 2020–2023 (USD MILLION)
                    TABLE 39 AUTOMOTIVE: MODEL-BASED ENTERPRISE MARKET, BY REGION, 2024–2029 (USD MILLION)
    8.4 CONSTRUCTION 
           8.4.1 GROWING DEMAND FOR DIGITAL SOLUTIONS TO REDUCE CONSTRUCTION PROJECT TIMELINE TO BOOST SEGMENTAL GROWTH
                    TABLE 40 CONSTRUCTION: MODEL-BASED ENTERPRISE MARKET, BY OFFERING, 2020–2023 (USD MILLION)
                    TABLE 41 CONSTRUCTION: MODEL-BASED ENTERPRISE MARKET, BY OFFERING, 2024–2029 (USD MILLION)
                    TABLE 42 CONSTRUCTION: MODEL-BASED ENTERPRISE MARKET, BY REGION, 2020–2023 (USD MILLION)
                    TABLE 43 CONSTRUCTION: MODEL-BASED ENTERPRISE MARKET, BY REGION, 2024–2029 (USD MILLION)
    8.5 RETAIL 
           8.5.1 RISING NEED FOR INTEGRATED PLATFORMS TO IMPROVE SUPPLY CHAIN MANAGEMENT TO DRIVE MARKET
                    TABLE 44 RETAIL: MODEL-BASED ENTERPRISE MARKET, BY OFFERING, 2020–2023 (USD MILLION)
                    TABLE 45 RETAIL: MODEL-BASED ENTERPRISE MARKET, BY OFFERING, 2024–2029 (USD MILLION)
                    TABLE 46 RETAIL: MODEL-BASED ENTERPRISE MARKET, BY REGION, 2020–2023 (USD MILLION)
                    TABLE 47 RETAIL: MODEL-BASED ENTERPRISE MARKET, BY REGION, 2024–2029 (USD MILLION)
    8.6 POWER & ENERGY 
           8.6.1 SURGING DEMAND FOR RENEWABLE ENERGY TO CONTRIBUTE TO SEGMENTAL GROWTH
                    TABLE 48 POWER & ENERGY: MODEL-BASED ENTERPRISE MARKET, BY OFFERING, 2020–2023 (USD MILLION)
                    TABLE 49 POWER & ENERGY: MODEL-BASED ENTERPRISE MARKET, BY OFFERING, 2024–2029 (USD MILLION)
                    TABLE 50 POWER & ENERGY: MODEL-BASED ENTERPRISE MARKET, BY REGION, 2020–2023 (USD MILLION)
                    TABLE 51 POWER & ENERGY: MODEL-BASED ENTERPRISE MARKET, BY REGION, 2024–2029 (USD MILLION)
    8.7 FOOD & BEVERAGES 
           8.7.1 INCREASING ENFORCEMENT OF STRINGENT REGULATIONS TO IMPROVE FOOD QUALITY TO AUGMENT SEGMENTAL GROWTH
                    TABLE 52 FOOD & BEVERAGES: MODEL-BASED ENTERPRISE MARKET, BY OFFERING, 2020–2023 (USD MILLION)
                    TABLE 53 FOOD & BEVERAGES: MODEL-BASED ENTERPRISE MARKET, BY OFFERING, 2024–2029 (USD MILLION)
                    TABLE 54 FOOD & BEVERAGES: MODEL-BASED ENTERPRISE MARKET, BY REGION, 2020–2023 (USD MILLION)
                    TABLE 55 FOOD & BEVERAGES: MODEL-BASED ENTERPRISE MARKET, BY REGION, 2024–2029 (USD MILLION)
    8.8 LIFE SCIENCES & HEALTHCARE 
           8.8.1 RISING EMPHASIS ON IMPROVING PATIENT CARE AND HEALTHCARE OPERATIONS TO PROPEL MARKET
                    TABLE 56 LIFE SCIENCES & HEALTHCARE: MODEL-BASED ENTERPRISE MARKET, BY OFFERING, 2020–2023 (USD MILLION)
                    TABLE 57 LIFE SCIENCES & HEALTHCARE: MODEL-BASED ENTERPRISE MARKET, BY OFFERING, 2024–2029 (USD MILLION)
                    TABLE 58 LIFE SCIENCES & HEALTHCARE: MODEL-BASED ENTERPRISE MARKET, BY REGION, 2020–2023 (USD MILLION)
                    TABLE 59 LIFE SCIENCES & HEALTHCARE: MODEL-BASED ENTERPRISE MARKET, BY REGION, 2024–2029 (USD MILLION)
    8.9 MARINE 
           8.9.1 MOUNTING INVESTMENT IN COMPUTER-AIDED TOOLS TO IMPROVE MARINE OPERATIONS TO FACILITATE MARKET GROWTH
                    TABLE 60 MARINE: MODEL-BASED ENTERPRISE MARKET, BY OFFERING, 2020–2023 (USD MILLION)
                    TABLE 61 MARINE: MODEL-BASED ENTERPRISE MARKET, BY OFFERING, 2024–2029 (USD MILLION)
                    TABLE 62 MARINE: MODEL-BASED ENTERPRISE MARKET, BY REGION, 2020–2023 (USD MILLION)
                    TABLE 63 MARINE: MODEL-BASED ENTERPRISE MARKET, BY REGION, 2024–2029 (USD MILLION)
    8.10 OIL & GAS 
           8.10.1 INCREASING DEPLOYMENT OF MODEL-BASED ENTERPRISE SOLUTIONS TO FACILITATE GLOBAL SHARING OF OIL & GAS INFORMATION TO DRIVE MARKET
                    TABLE 64 OIL & GAS: MODEL-BASED ENTERPRISE MARKET, BY OFFERING, 2020–2023 (USD MILLION)
                    TABLE 65 OIL & GAS: MODEL-BASED ENTERPRISE MARKET, BY OFFERING, 2024–2029 (USD MILLION)
                    TABLE 66 OIL & GAS: MODEL-BASED ENTERPRISE MARKET, BY REGION, 2020–2023 (USD MILLION)
                    TABLE 67 OIL & GAS: MODEL-BASED ENTERPRISE MARKET, BY REGION, 2024–2029 (USD MILLION)
    8.11 ELECTRONICS & TELECOMMUNICATIONS 
           8.11.1 RISING COMPLEXITY OF ELECTRONICS & TELECOMMUNICATION EQUIPMENT MANUFACTURING TO AUGMENT SEGMENTAL GROWTH
                    TABLE 68 ELECTRONICS & TELECOMMUNICATIONS: MODEL-BASED ENTERPRISE MARKET, BY OFFERING, 2020–2023 (USD MILLION)
                    TABLE 69 ELECTRONICS & TELECOMMUNICATIONS: MODEL-BASED ENTERPRISE MARKET, BY OFFERING, 2024–2029 (USD MILLION)
                    TABLE 70 ELECTRONICS & TELECOMMUNICATIONS: MODEL-BASED ENTERPRISE MARKET, BY REGION, 2020–2023 (USD MILLION)
                    TABLE 71 ELECTRONICS & TELECOMMUNICATIONS: MODEL-BASED ENTERPRISE MARKET, BY REGION, 2024–2029 (USD MILLION)
    8.12 OTHER INDUSTRIES 
           TABLE 72 OTHER INDUSTRIES: MODEL-BASED ENTERPRISE MARKET, BY OFFERING, 2020–2023 (USD MILLION)
           TABLE 73 OTHER INDUSTRIES: MODEL-BASED ENTERPRISE MARKET, BY OFFERING, 2024–2029 (USD MILLION)
           TABLE 74 OTHER INDUSTRIES: MODEL-BASED ENTERPRISE MARKET, BY REGION, 2020–2023 (USD MILLION)
           TABLE 75 OTHER INDUSTRIES: MODEL-BASED ENTERPRISE MARKET, BY REGION, 2024–2029 (USD MILLION)
 
9 MODEL-BASED ENTERPRISE MARKET, BY REGION (Page No. - 109)
    9.1 INTRODUCTION 
           FIGURE 43 MODEL-BASED ENTERPRISE MARKET, BY REGION
           FIGURE 44 INDIA TO EXHIBIT HIGHEST CAGR IN MODEL-BASED ENTERPRISE MARKET DURING FORECAST PERIOD
           TABLE 76 MODEL-BASED ENTERPRISE MARKET, BY REGION, 2020–2023 (USD MILLION)
           TABLE 77 MODEL-BASED ENTERPRISE MARKET, BY REGION, 2024–2029 (USD MILLION)
    9.2 NORTH AMERICA 
           9.2.1 RECESSION IMPACT ON MODEL-BASED ENTERPRISE MARKET IN NORTH AMERICA
                    FIGURE 45 NORTH AMERICA: MODEL-BASED ENTERPRISE MARKET SNAPSHOT
                    FIGURE 46 US TO HOLD LARGEST SHARE OF NORTH AMERICAN MODEL-BASED ENTERPRISE MARKET IN 2029
                    TABLE 78 NORTH AMERICA: MODEL-BASED ENTERPRISE MARKET, BY COUNTRY, 2020–2023 (USD MILLION)
                    TABLE 79 NORTH AMERICA: MODEL-BASED ENTERPRISE MARKET, BY COUNTRY, 2024–2029 (USD MILLION)
                    TABLE 80 NORTH AMERICA: MODEL-BASED ENTERPRISE MARKET, BY OFFERING, 2020–2023 (USD MILLION)
                    TABLE 81 NORTH AMERICA: MODEL-BASED ENTERPRISE MARKET, BY OFFERING, 2024–2029 (USD MILLION)
                    TABLE 82 NORTH AMERICA: MODEL-BASED ENTERPRISE MARKET, BY INDUSTRY, 2020–2023 (USD MILLION)
                    TABLE 83 NORTH AMERICA: MODEL-BASED ENTERPRISE MARKET, BY INDUSTRY, 2024–2029 (USD MILLION)
           9.2.2 US
                    9.2.2.1 Increasing adoption of digital technologies to contribute to market growth
           9.2.3 CANADA
                    9.2.3.1 Rising emphasis on achieving Industry 4.0 targets to foster market growth
           9.2.4 MEXICO
                    9.2.4.1 Surging need for software to optimize manufacturing costs and efficiency to propel market
    9.3 EUROPE 
           9.3.1 RECESSION IMPACT ON MODEL-BASED ENTERPRISE MARKET IN EUROPE
                    FIGURE 47 EUROPE: MODEL-BASED ENTERPRISE MARKET SNAPSHOT
                    FIGURE 48 GERMANY TO REGISTER HIGHEST CAGR IN EUROPEAN MODEL-BASED ENTERPRISE MARKET FROM 2024 TO 2029
                    TABLE 84 EUROPE: MODEL-BASED ENTERPRISE MARKET, BY COUNTRY, 2020–2023 (USD MILLION)
                    TABLE 85 EUROPE: MODEL-BASED ENTERPRISE MARKET, BY COUNTRY, 2024–2029 (USD MILLION)
                    TABLE 86 EUROPE: MODEL-BASED ENTERPRISE MARKET, BY OFFERING, 2020–2023 (USD MILLION)
                    TABLE 87 EUROPE: MODEL-BASED ENTERPRISE MARKET, BY OFFERING, 2024–2029 (USD MILLION)
                    TABLE 88 EUROPE: MODEL-BASED ENTERPRISE MARKET, BY INDUSTRY, 2020–2023 (USD MILLION)
                    TABLE 89 EUROPE: MODEL-BASED ENTERPRISE MARKET, BY INDUSTRY, 2024–2029 (USD MILLION)
           9.3.2 UK
                    9.3.2.1 Rising number of incentive programs for innovative technologies to propel market
           9.3.3 GERMANY
                    9.3.3.1 Increasing initiatives to support computerized manufacturing to expedite market growth
           9.3.4 FRANCE
                    9.3.4.1 Surging demand for cloud computing and IoT technologies to fuel market growth
           9.3.5 REST OF EUROPE
    9.4 ASIA PACIFIC 
           9.4.1 RECESSION IMPACT ON MODEL-BASED ENTERPRISE MARKET IN ASIA PACIFIC
                    FIGURE 49 ASIA PACIFIC: MODEL-BASED ENTERPRISE MARKET SNAPSHOT
                    FIGURE 50 CHINA TO DOMINATE ASIA PACIFIC MODEL-BASED ENTERPRISE MARKET FROM 2024 TO 2029
                    TABLE 90 ASIA PACIFIC: MODEL-BASED ENTERPRISE MARKET, BY COUNTRY, 2020–2023 (USD MILLION)
                    TABLE 91 ASIA PACIFIC: MODEL-BASED ENTERPRISE MARKET, BY COUNTRY, 2024–2029 (USD MILLION)
                    TABLE 92 ASIA PACIFIC: MODEL-BASED ENTERPRISE MARKET, BY OFFERING, 2020–2023 (USD MILLION)
                    TABLE 93 ASIA PACIFIC: MODEL-BASED ENTERPRISE MARKET, BY OFFERING, 2024–2029 (USD MILLION)
                    TABLE 94 ASIA PACIFIC: MODEL-BASED ENTERPRISE MARKET, BY INDUSTRY, 2020–2023 (USD MILLION)
                    TABLE 95 ASIA PACIFIC: MODEL-BASED ENTERPRISE MARKET, BY INDUSTRY, 2024–2029 (USD MILLION)
           9.4.2 JAPAN
                    9.4.2.1 Rising deployment of digital technologies to augment market growth
           9.4.3 CHINA
                    9.4.3.1 Increasing adoption of advanced manufacturing strategies to contribute to market growth
           9.4.4 INDIA
                    9.4.4.1 Mounting demand for supply chain management technologies to accelerate market growth
           9.4.5 SOUTH KOREA
                    9.4.5.1 Rising emphasis on development of industrial and manufacturing sectors through digital revolution to boost market growth
           9.4.6 AUSTRALIA
                    9.4.6.1 Increasing implementation of digital economy strategies to facilitate market growth
           9.4.7 REST OF ASIA PACIFIC
    9.5 ROW 
           9.5.1 RECESSION IMPACT ON MODEL-BASED ENTERPRISE MARKET IN ROW
                    FIGURE 51 SOUTH AMERICA TO ACCOUNT FOR LARGEST SHARE OF ROW MODEL-BASED ENTERPRISE MARKET IN 2029
                    TABLE 96 ROW: MODEL-BASED ENTERPRISE MARKET, BY REGION, 2020–2023 (USD MILLION)
                    TABLE 97 ROW: MODEL-BASED ENTERPRISE MARKET, BY REGION, 2024–2029 (USD MILLION)
                    TABLE 98 ROW: MODEL-BASED ENTERPRISE MARKET, BY OFFERING, 2020–2023 (USD MILLION)
                    TABLE 99 ROW: MODEL-BASED ENTERPRISE MARKET, BY OFFERING, 2024–2029 (USD MILLION)
                    TABLE 100 ROW: MODEL-BASED ENTERPRISE MARKET, BY INDUSTRY, 2020–2023 (USD MILLION)
                    TABLE 101 ROW: MODEL-BASED ENTERPRISE MARKET, BY INDUSTRY, 2024–2029 (USD MILLION)
           9.5.2 MIDDLE EAST
                    TABLE 102 MIDDLE EAST: MODEL-BASED ENTERPRISE MARKET, BY COUNTRY/REGION, 2020–2023 (USD MILLION)
                    TABLE 103 MIDDLE EAST: MODEL-BASED ENTERPRISE MARKET, BY COUNTRY/REGION, 2024–2029 (USD MILLION)
                    9.5.2.1 GCC countries
                               9.5.2.1.1 Increasing adoption of 3D modelling and PLM tools to drive market
                    9.5.2.2 Rest of Middle East
           9.5.3 AFRICA
                    9.5.3.1 Rising focus on ensuring reliable energy supply to boost digital transformation to drive market
           9.5.4 SOUTH AMERICA
                    9.5.4.1 Increasing internet usage and technological innovation to foster market growth
 
10 COMPETITIVE LANDSCAPE (Page No. - 136)
     10.1 INTRODUCTION 
     10.2 STRATEGIES ADOPTED BY KEY PLAYERS, 2021–2023 
             TABLE 104 MODEL-BASED ENTERPRISE MARKET: OVERVIEW OF STRATEGIES ADOPTED BY KEY PLAYERS, 2021–2023
     10.3 REVENUE ANALYSIS, 2018–2022 
             FIGURE 52 MODEL-BASED ENTERPRISE MARKET: REVENUE ANALYSIS OF KEY PLAYERS, 2018–2022
     10.4 MARKET SHARE ANALYSIS, 2023 
             TABLE 105 MODEL-BASED ENTERPRISE MARKET: DEGREE OF COMPETITION, 2023
             FIGURE 53 MODEL-BASED ENTERPRISE MARKET SHARE ANALYSIS, 2023
     10.5 COMPANY VALUATION AND FINANCIAL METRICS, 2023 
             FIGURE 54 MODEL-BASED ENTERPRISE MARKET: COMPANY VALUATION, 2023 (USD MILLION)
             FIGURE 55 MODEL-BASED ENTERPRISE MARKET: FINANCIAL METRICS (EV/EBITDA), 2023
     10.6 BRAND/PRODUCT COMPARISON 
             FIGURE 56 MODEL-BASED ENTERPRISE MARKET: BRAND/PRODUCT COMPARISON
     10.7 COMPANY EVALUATION MATRIX: KEY PLAYERS, 2023 
             10.7.1 STARS
             10.7.2 EMERGING LEADERS
             10.7.3 PERVASIVE PLAYERS
             10.7.4 PARTICIPANTS
                        FIGURE 57 MODEL-BASED ENTERPRISE MARKET: COMPANY EVALUATION MATRIX (KEY PLAYERS), 2023
             10.7.5 COMPANY FOOTPRINT: KEY PLAYERS, 2023
                        10.7.5.1 Overall footprint
                                     FIGURE 58 MODEL-BASED ENTERPRISE MARKET: OVERALL FOOTPRINT
                        10.7.5.2 Industry footprint
                                     TABLE 106 MODEL-BASED ENTERPRISE MARKET: INDUSTRY FOOTPRINT
                        10.7.5.3 Offering footprint
                                      TABLE 107 MODEL-BASED ENTERPRISE MARKET: OFFERING FOOTPRINT
                        10.7.5.4 Deployment type footprint
                                     TABLE 108 MODEL-BASED ENTERPRISE MARKET: DEPLOYMENT TYPE FOOTPRINT
                        10.7.5.5 Region footprint
                                     TABLE 109 MODEL-BASED ENTERPRISE MARKET: REGION FOOTPRINT
     10.8 COMPANY EVALUATION MATRIX: STARTUPS/SMES, 2023 
             10.8.1 PROGRESSIVE COMPANIES
             10.8.2 RESPONSIVE COMPANIES
             10.8.3 DYNAMIC COMPANIES
             10.8.4 STARTING BLOCKS
                        FIGURE 59 MODEL-BASED ENTERPRISE MARKET: COMPANY EVALUATION MATRIX (STARTUPS/SMES), 2023
             10.8.5 COMPETITIVE BENCHMARKING: STARTUPS/SMES, 2023
                        10.8.5.1 List of key startups/SMEs
                                     TABLE 110 MODEL-BASED ENTERPRISE MARKET: LIST OF KEY STARTUPS/SMES
                        10.8.5.2 Competitive benchmarking of key startups/SMEs
                                     TABLE 111 MODEL-BASED ENTERPRISE MARKET: STARTUPS/SMES FOOTPRINT
     10.9 COMPETITIVE SCENARIOS AND TRENDS 
             10.9.1 PRODUCT LAUNCHES
                        TABLE 112 MODEL-BASED ENTERPRISE MARKET: PRODUCT LAUNCHES, APRIL 2022–MARCH 2023
             10.9.2 DEALS
                        TABLE 113 MODEL-BASED ENTERPRISE MARKET: DEALS, JANUARY 2021–FEBRUARY 2024
 
11 COMPANY PROFILES (Page No. - 156)
(Business Overview, Products/Solutions/Services Offered, Recent Developments, and MnM View (Key strengths/Right to Win, Strategic Choices Made, and Weaknesses and Competitive Threats))*  
     11.1 KEY PLAYERS 
             11.1.1 SIEMENS
                        TABLE 114 SIEMENS: COMPANY OVERVIEW
                        FIGURE 60 SIEMENS: COMPANY SNAPSHOT
                        TABLE 115 SIEMENS: PRODUCTS/SOLUTIONS/SERVICES OFFERED
             11.1.2 PTC
                        TABLE 116 PTC: COMPANY OVERVIEW
                        FIGURE 61 PTC: COMPANY SNAPSHOT
                        TABLE 117 PTC: PRODUCTS/SOLUTIONS/SERVICES OFFERED
                        TABLE 118 PTC: PRODUCT LAUNCHES
                        TABLE 119 PTC: DEALS
             11.1.3 DASSAULT SYSTÈMES
                        TABLE 120 DASSAULT SYSTÈMES: COMPANY OVERVIEW
                        FIGURE 62 DASSAULT SYSTÈMES: COMPANY SNAPSHOT
                        TABLE 121 DASSAULT SYSTÈMES: PRODUCTS/SOLUTIONS/SERVICES OFFERED
                        TABLE 122 DASSAULT SYSTÈMES: DEALS
             11.1.4 SAP
                        TABLE 123 SAP: COMPANY OVERVIEW
                        FIGURE 63 SAP: COMPANY SNAPSHOT
                        TABLE 124 SAP: PRODUCTS/SOLUTIONS/SERVICES OFFERED
                        TABLE 125 SAP: DEALS
             11.1.5 AUTODESK INC.
                        TABLE 126 AUTODESK INC.: COMPANY OVERVIEW
                        FIGURE 64 AUTODESK INC.: COMPANY SNAPSHOT
                        TABLE 127 AUTODESK INC.: PRODUCTS/SOLUTIONS/SERVICES OFFERED
             11.1.6 HCL TECHNOLOGIES LIMITED
                        TABLE 128 HCL TECHNOLOGIES LIMITED: COMPANY OVERVIEW
                        FIGURE 65 HCL TECHNOLOGIES LIMITED: COMPANY SNAPSHOT
                        TABLE 129 HCL TECHNOLOGIES LIMITED: PRODUCTS/SOLUTIONS/SERVICES OFFERED
             11.1.7 ORACLE
                        TABLE 130 ORACLE: COMPANY OVERVIEW
                        FIGURE 66 ORACLE: COMPANY SNAPSHOT
                        TABLE 131 ORACLE: PRODUCTS/SOLUTIONS/SERVICES OFFERED
                        TABLE 132 ORACLE: DEALS
             11.1.8 WIPRO
                        TABLE 133 WIPRO: COMPANY OVERVIEW
                        FIGURE 67 WIPRO: COMPANY SNAPSHOT
                        TABLE 134 WIPRO: PRODUCTS/SOLUTIONS/SERVICES OFFERED
                        TABLE 135 WIPRO: DEALS
             11.1.9 ANSYS, INC
                        TABLE 136 ANSYS, INC: COMPANY OVERVIEW
                        FIGURE 68 ANSYS, INC: COMPANY SNAPSHOT
                        TABLE 137 ANSYS, INC: PRODUCTS/SOLUTIONS/SERVICES OFFERED
                        TABLE 138 ANSYS, INC: DEALS
             11.1.10 BENTLEY SYSTEMS, INCORPORATED
                        TABLE 139 BENTLEY SYSTEMS, INCORPORATED: COMPANY OVERVIEW
                        FIGURE 69 BENTLEY SYSTEMS, INCORPORATED: COMPANY SNAPSHOT
                        TABLE 140 BENTLEY SYSTEMS, INCORPORATED: PRODUCTS/SOLUTIONS/SERVICES OFFERED
     11.2 OTHER PLAYERS 
             11.2.1 ARAS
             11.2.2 ANARK CORPORATION
             11.2.3 INFOR
             11.2.4 IBASE-T
             11.2.5 VIAS3D
             11.2.6 CTSOLUTIONS.ES
             11.2.7 CAPVIDIA
             11.2.8 COMBITECH
             11.2.9 ZUKEN
             11.2.10 RHEA GROUP
             11.2.11 TOM SAWYER SOFTWARE
             11.2.12 GS ENGINEERING INC.
             11.2.13 COLLINS AEROSPACE
             11.2.14 TRIGON CYBER
             11.2.15 JAMA SOFTWARE
*Details on Business Overview, Products/Solutions/Services Offered, Recent Developments, and MnM View (Key strengths/Right to Win, Strategic Choices Made, and Weaknesses and Competitive Threats) might not be captured in case of unlisted companies.  
 
12 ADJACENT MARKET (Page No. - 199)
     12.1 INTRODUCTION 
     12.2 SMART MANUFACTURING MARKET, BY ENABLING TECHNOLOGY 
             TABLE 141 SMART MANUFACTURING MARKET, BY ENABLING TECHNOLOGY, 2019–2022 (USD MILLION)
             TABLE 142 SMART MANUFACTURING MARKET, BY ENABLING TECHNOLOGY, 2023–2028 (USD MILLION)
             TABLE 143 ENABLING TECHNOLOGY: SMART MANUFACTURING MARKET, BY REGION, 2019–2022 (USD MILLION)
             TABLE 144 ENABLING TECHNOLOGY: SMART MANUFACTURING MARKET, BY REGION, 2023–2028 (USD MILLION)
             TABLE 145 ENABLING TECHNOLOGY: SMART MANUFACTURING MARKET, BY PROCESS INDUSTRY, 2019–2022 (USD MILLION)
             TABLE 146 ENABLING TECHNOLOGY: SMART MANUFACTURING MARKET, BY PROCESS INDUSTRY, 2023–2028 (USD MILLION)
             TABLE 147 ENABLING TECHNOLOGY: SMART MANUFACTURING MARKET, BY DISCRETE INDUSTRY, 2019–2022 (USD MILLION)
             TABLE 148 ENABLING TECHNOLOGY: SMART MANUFACTURING MARKET, BY DISCRETE INDUSTRY, 2023–2028 (USD MILLION)
             12.2.1 INDUSTRIAL 3D PRINTING
                        12.2.1.1 Emphasis on simplifying manufacturing of parts with complex designs to boost segmental growth
             12.2.2 INDUSTRIAL 3D PRINTING, BY OFFERING
                        12.2.2.1 Printers
                        12.2.2.2 Materials
                        12.2.2.3 Software
                        12.2.2.4 Services
 
13 APPENDIX (Page No. - 206)
     13.1 INSIGHTS FROM INDUSTRY EXPERTS 
     13.2 DISCUSSION GUIDE 
     13.3 KNOWLEDGESTORE: MARKETSANDMARKETS’ SUBSCRIPTION PORTAL 
     13.4 CUSTOMIZATION OPTIONS 
     13.5 RELATED REPORTS 
     13.6 AUTHOR DETAILS 


The study involved four major activities in estimating the current size of the model based enterprise market. Exhaustive secondary research has been done to collect information on the market, peer, and parent markets. The next step has been to validate these findings, assumptions, and sizing with industry experts across the value chain through primary research. Both top-down and bottom-up approaches have been employed to estimate the total market size. After that, market breakdown and data triangulation methods were used to estimate the market size of segments and subsegments. Two sources of information-secondary and primary-have been used to identify and collect information for an extensive technical and commercial study of the model based enterprise market.

Secondary Research

Secondary sources include company websites, magazines, industry news, associations, and databases (Factiva and Bloomberg). These secondary sources include annual reports, press releases, investor presentations of companies, white papers, certified publications, articles by recognized authors, regulatory bodies, trade directories, and databases.

Primary Research

Primary sources mainly consist of several experts from the core and related industries, along with preferred model based enterprise software providers, distributors, alliances, standards, and certification organizations related to various segments of this industry’s value chain.

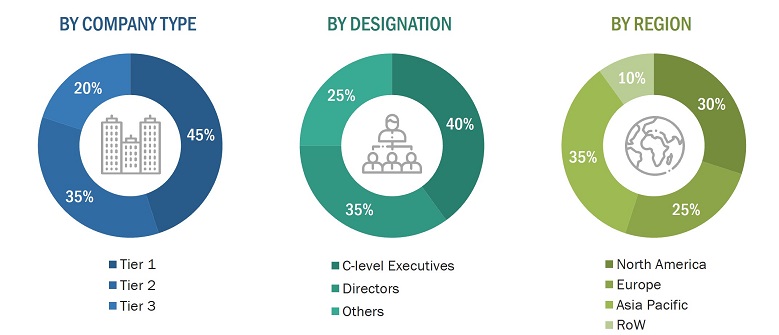
In the primary research process, various primary sources from both the supply and demand sides were interviewed to obtain qualitative and quantitative information on the market. The primary sources from the supply side included various industry experts such as Chief Experience Officers (CXOs), Vice Presidents (VPs), and Directors from business development, marketing, product development/innovation teams, and related key executives from model based enterprise software providers, such as Siemens (Germany), PTC (US), Dassault Systèmes (France), SAP (Germany), Autodesk Inc. (US), HCL Technologies Limited (India), and Oracle (US); research organizations, distributors, industry associations, and key opinion leaders. Following is the breakdown of primary respondents.
Model Based Enterprise Market
 Size, and Share

To know about the assumptions considered for the study, download the pdf brochure

Market Size Estimation

Both top-down and bottom-up approaches have been used to estimate and validate the total size of the model based enterprise market. These methods have also been used extensively to estimate the size of various subsegments in the market. The following research methodology has been used to estimate the market size:

  • Major players in the industry and markets have been identified through extensive secondary research.
  • The industry’s value chain and market size (in terms of value) have been determined through primary and secondary research processes.
  • All percentage shares, splits, and breakdowns have been determined using secondary sources and verified through primary sources.

Top-Down Approach

In the top-down approach, the overall market size has been used to estimate the size of the individual market segments (mentioned in market segmentation) through percentage splits from secondary and primary research. For specific market segments, the size of the most appropriate immediate parent market has been used to implement the top-down approach. The bottom-up approach has also been implemented for data obtained from secondary research to validate the market size of various segments.

Model Based Enterprise Market: Top-down Approach

Model Based Enterprise Market
 Size, and Top-down Approach

Bottom-Up Approach

The bottom-up approach has been used to arrive at the overall size of the model based enterprise market from the revenues of the key players and their market shares. Calculations based on revenues of key companies identified in the market led to the estimation of their overall market size.

Model Based Enterprise Market: Bottom-up Approach

Model Based Enterprise Market
 Size, and Bottom-Up Approach

Data Triangulation

After arriving at the overall market size from the estimation process explained above, the overall market has been split into several segments and subsegments. The market breakdown and data triangulation procedures have been employed, wherever applicable, to complete the overall market engineering process and arrive at the exact statistics for all segments and subsegments. The data has been triangulated by studying various factors and trends from both the demand and supply sides. The market has also been validated using both top-down and bottom-up approaches.

Market Definition

Model based enterprise is a global initiative to augment 3D models with additional information to create new documentation deliverables beyond engineering. This Model Based Enterprise (MBE) initiatives are constructed on Model Based Definition (MBD) initiatives as a 3D model with embedded PMI (Product Manufacturing Information) to offer integrated and collaborative environment and to transform an enterprise’s engineering, manufacturing, and aftermarket services through product data reuse and derived context rather than interpreting inputs and recreating the models and drawings. MBE utilizes the standard CAD functionality of layers and saved views to provide the user access to just the information required.

Key Stakeholders

  • Industry associations
  • Associations and regulatory authorities related to 3D modeling
  • Government bodies, venture capitalists, and private equity firms
  • Manufacturers of model based enterprise solutions
  • Maintenance personnel, developers, and suppliers of model based enterprise offerings
  • Research institutes and organizations

Report Objectives

  • To define and forecast the model based enterprise market regarding offering, deployment type, and industry.
  • To describe and forecast the model based enterprise market and its value segments for four regions—North America, Europe, Asia Pacific, and the Rest of the World (RoW), along with their respective countries.
  • To provide detailed information regarding the drivers, restraints, opportunities, and challenges influencing the growth of the market
  • To strategically analyze micro-markets concerning individual growth trends, prospects, and contributions to the overall market
  • To study the complete value chain of the model based enterprise market
  • To analyze opportunities in the market for stakeholders by identifying high-growth segments of the market
  • To strategically profile key players and comprehensively analyze their market position regarding ranking and core competencies, along with a detailed market competitive landscape.
  • To analyze strategic approaches such as agreements, collaborations, and partnerships in the model based enterprise market
  • To provide an analysis of the recession impact on the growth of the market and its segments

Available Customizations:

Based on the given market data, MarketsandMarkets offers customizations in the reports according to the client’s specific requirements. The available customization options are as follows:

Company Information

  • Detailed analysis and profiling of additional market players (up to 5)
Custom Market Research Services

We will customize the research for you, in case the report listed above does not meet with your exact requirements. Our custom research will comprehensively cover the business information you require to help you arrive at strategic and profitable business decisions.

Request Customization
Report Code
SE 6831
Published ON
Apr, 2024
Choose License Type
BUY NOW
  • SHARE
X
Request Customization
Speak to Analyst
Speak to Analyst
OR FACE-TO-FACE MEETING
PERSONALIZE THIS RESEARCH
  • Triangulate with your Own Data
  • Get Data as per your Format and Definition
  • Gain a Deeper Dive on a Specific Application, Geography, Customer or Competitor
  • Any level of Personalization
REQUEST A FREE CUSTOMIZATION
LET US HELP YOU!
  • What are the Known and Unknown Adjacencies Impacting the Model Based Enterprise Market
  • What will your New Revenue Sources be?
  • Who will be your Top Customer; what will make them switch?
  • Defend your Market Share or Win Competitors
  • Get a Scorecard for Target Partners
CUSTOMIZED WORKSHOP REQUEST
+1-888-600-6441
  • Call Us
  • +1-888-600-6441 (Corporate office hours)
  • +1-888-600-6441 (US/Can toll free)
  • +44-800-368-9399 (UK office hours)
CONNECT WITH US
ABOUT TRUST ONLINE
©2024 MarketsandMarkets Research Private Ltd. All rights reserved
DMCA.com Protection Status Website Feedback